Monday, August 31, 2009

Bernanke's Achilles Heel

Every time the price of oil has spike at least 100% within a year it has led to a recession. The jump to $147 was the straw that broke the economy's back last year.

Bernanke's attempt to print our way out of this problem has again spiked the price of oil. This time it's happening with official unemployment over 9% and unofficial employment over 15%. Is that really what we want in a global economy that's struggling?

Eventually this is going to push the economy back into decline despite the Fed's attempt to artificially stimulate by flooding the world with more liquidity.

The question is only a matter of timing. Was $75 high enough to start the process or will the momentum created by printing several trillion dollars continue to carry us higher for a little while longer? Either way I doubt this cyclical bull market will last anywhere near as long as the last one. Probably a year or less if I had to guess.

Friday, August 28, 2009

Keep it simple


It seems like everyone has been trying to pick a top in the market since the S&P reached 875. I've seen an endless parade of reasons for why the market is topping, most of them technical in nature. Which kind of backs up my point that technical analysis alone really doesn't give one a long term edge.

At some point the market will top out and I expect we will see the usual chest beating about how this or that method correctly spotted the top...probably after missing the top multiple times.

Perhaps a simple approach might be a better plan of action.

The S&P is holding above it's trend line and the 200 DMA is rising. Until we see a break of that trend the direction is clearly up and a rising 200 DMA would suggest we are now dealing with a cyclical bull market (within a longer term secular bear market).

Even when the market does break the trend line the odds are good that there is going to be a test of the highs (as in a 1-2-3 reversal) so there's no call for trying to pick a top at this time unless one is trying to day trade intraday swings (good luck in this volatile market).

The dollar on the other hand is declining and below it's longer term trend line. The 200 DMA is falling. That suggests that the long term secular bear market is again in force.

Many analysts and bloggers can be very convincing with their reasoning, but let's not forget the fact that no one can see the future and yesterdays market direction really has no bearing on tomorrows (one really can't determine the future by looking at the past).

Tuesday, August 25, 2009

Trading gold ? No thanks!

I tend to think we have entered another C wave advance in gold. These C waves don't come around all that often. In my opinion it's a huge mistake to think one can successfully jump in and out of a C wave. Gold is simply too volatile to successfully time every little wiggle.

The last C wave took a year to consolidate before breaking out and surging over $1000.

I suspect anyone who tried to trade in and out of that consolidation probably just managed to whittle away at their cash all the while reinforcing a trading mentality that would have cost them dearly once the breakout occurred in Oct of 07.

A subscriber asked the question yesterday if the subscription service would be beneficial to his trading. My response is no. I will not be doing any trading as this C wave unfolds. It's too important to me not to miss any of the move and not to incur multiple losses during this volatile period.

What I can do is keep you focused on the big picture and ultimately that is the key to huge profits during this secular bull market.

Monday, August 24, 2009

Trading mistakes

Today I’m going to share some of the goofs and blunders that I’ve made over the years and hopefully keep some of you from making the same mistakes.

Number one on the list. Trading too large.

Without a doubt this is the single biggest mistake that everyone makes when they start investing (and continue to make throughout their career). It is also the one mistake that is guaranteed to ruin ones account. The problem with trading a large position comes if you get lucky and win, especially if it happens very early in your trading career. I know that sounds counter intuitive but here’s what happens when you make a huge bet and win. You get cocky and think it’s easy to get rich in the stock market. You become convinced you are smarter than everyone else and have the market “wired”.

So instead of putting your winnings in your pocket and going home you stay at the table. Does anyone know what happens if you stay at the casino long enough? That’s right you lose your money. In the casino you lose because the odds are against you. In the stock market you lose because you took on too much risk. No matter how good you are, you simply aren’t going to win more than 60-65% of the time over the long haul. As a matter of fact only the very best can boast a long term win rate of 65%. If you are trading with leverage that other 35% of the time when you “miss” will bankrupt you in the blink of an eye.

Number two on the list. Overtrading.

For some reason we are hardwired to think we have to be doing something in order to make progress. The cold hard fact is that one rarely has a true edge in the market and you certainly don’t get one every day. As an example, how often do we see a Bollinger band crash trade? Maybe 5-10 times a year unless the market is extremely volatile. If you are going to trade at least wait till you really have the odds in your favor and I would even suggest you wait till they are heavily in your favor if you want to make lasting long term gains.

Number three. Trying to indicator your way to riches.

I seriously doubt anyone is going to make any lasting gains by trying to indicator their way to riches. Let’s face it, if it’s an indicator that you have access to then the big boys are going to have it too and the market is going to discount it. The market will eventually tear down every system and that includes any indicator that has worked too long.

Number Four. Divergences

I often see investors get excited because a certain index did or didn’t confirm another or because an indicator is showing a divergence. The problem with divergences is that the divergence can last for a long time or it can simply fade away if the market continues long enough in the right direction. I seriously doubt that trying to trade divergences is anything more than a 50/50 crap shoot.

Number five. Technical analysis.

There is something in the human brain that seeks out order. When we look at a chart we see patterns and trend lines that our brains need to believe represent meaning in the market. The truth is much of the stock market is just random chaos. Now I know some of you are going to tell me that you consistently make money with technical analysis. However, history has shown that long term, technical analysis alone really shows no consistent edge. Traders who make money don’t make it because of their technical analysis of the charts, they make it despite that, and they do it because they have excellent risk management and stone cold discipline. Traders make money because they wait till they have an edge and they keep their risk manageable in case they are wrong, not because of any pattern or trend line on a chart. I can pretty much guarantee that for every technical setup you show me that worked I can find another one exactly the same that failed.

Number 6. Overbought/oversold levels.

This one is going to be important as the gold bull progresses. Too often traders will lose their positions because the oscillators get overbought or oversold. I dare say that many traders probably lost their positions during the recent run in stocks. During that time the 3 day RSI got to ridiculously overbought levels. If one sold looking for a pullback they missed a big portion of the move. We are going to see the same thing happen during the gold bull only it will probably be even worse. I expect a great many investors are going to lose their position as gold moves past the $1000 level because gold is going to get overbought. I expect we will start to see mass exodus at around $1100 brought on by nothing more than overbought oscillators. Remember bull markets get overbought, then they get even more overbought as investors start to chase. You probably will do yourself a big favor by taking the oscillators off your screen after gold crosses $1000.

Number 7. Skipping over the rally.

Here’s one I did religiously during the market rally out of the 03 bottom. As the market got overbought I would take profits looking to get in at lower levels. Unfortunately what usually happened was the market just kept rising and the pain of watching the market leave me behind would be too great and I would end up re-entering at higher levels. All I managed to do was skip over significant profits. The added benefit is that
when I gave in to the rally and bought at higher prices that was usually when the correction began, so I would just end up with an immediate loss. This is an excellent way to lose money in a strong bull run.

Number 8. Stops too tight.

The pros just love this one. Obvious stops will get run almost every time. If you have the hubris to think that you can pick exact turning points in the market, especially intraday, then you probably deserve to lose your money. I can’t tell you how often I see posts on blogs about how such and such a level will curtail or accelerate a move. The pros probably just love to take money from these bumblies. The market just isn’t that simple. Support and resistance levels probably get run more often than they hold. Just go take a look at the market bottom in 02 and the top in 07 if you don’t believe me.

There are many ways to screw up in this business but these are just some of the more successful ones I’ve discovered during my career. Hopefully most of you are smarter than I was

Sunday, August 23, 2009

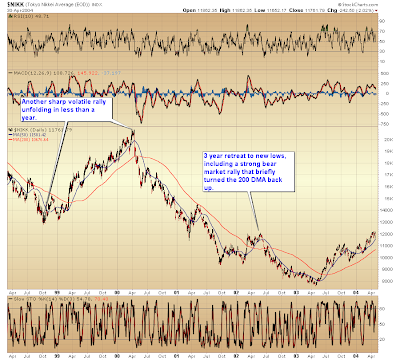
Japan during the deflationary 90's


I'm going to take a look at the Nikkei during the extreme deflationary period following the collapse of the Japanese real estate and stock market bubble. Why? Because the US is in a very similar situation. We are also trying the exact same “fix” of propping up the failed banking system that Japan opted for, which failed miserably BTW.
What we see is a decade of explosive cyclical bull markets driven by nothing other than monetary expansion. Since this strategy never really cured the underlying fundamental problems every single one of these rallies eventually topped out and was followed by a long slow decline to new lows. At which point more stimulus was applied with the same result, another explosive rally and another grueling decline to lower lows.

The argument today is that we are in a deflationary environment and no amount of money creation is going to be able to keep up with the deflationary forces caused by the implosion of history’s largest credit bubble. I’ll point out that Japan experienced massive deflation during this period yet monetary stimulus was able to spawn multiple cyclical bull markets. I’m not sure we should assume that simply because we are in a deflationary environment the stock market won’t be able to rise. The Japanese model seems to suggest that a determined central bank can create asset inflation even in a deflationary environment.

Since we are doing the same thing that Japan did there is probably a decent chance we will experience a similar result.

A great many investors and money managers have been surprised by the stock market's relentless march higher. But as you look at the charts of the Nikkei we see that’s exactly what happened in Japan. Every rally unfolded in under a year. Almost every decline took much longer. For the impatient trader you were better off playing the long side because the gains came much faster than the losses.

There’s probably a pretty good chance that something similar is in our future for the next decade or two. This is going to be a market timers nightmare. History has already shown that the majority of market timers don’t make much if any lasting long term gains in the market. Add in extreme volatility and ever greater government intervention and you end up with a market that’s going to be next to impossible to trade effectively. Sure a few may get lucky from time to time but over the next 10-20 years I dare say almost no one is going to make any lasting money trying to guess the markets volatile gyrations as it gets pulled back and forth by the deflationary forces and the governments attempts to thwart them. Traders are probably going to be running up a mountain of sand for years to come.

So far we’ve seen the COT fail. We’ve seen most trend lines and patterns fail. The cycles have started to perform poorly. Sentiment has become for the most part meaningless. Overbought and oversold levels have been useless. 75 years of Lowry’s data went down the drain. All in all this market has managed to take away just about every tool that investors use to get an edge in the market.

Take a close look at all four of those cyclical rallies. Not only were the rallies extremely violent with all but one showing no inclination to test the bottom but the topping process was normally extended and the retreats were slow grinding affairs with multiple volatile reversals. Like I said a market timers nightmare.

I'm starting to lean in this direction as it is beginning to appear that the Fed may have aborted the current left translated 4 year cycle with a avalanche of liquidity, similar to Japan.

Friday, August 21, 2009

Scare you out or wear you out

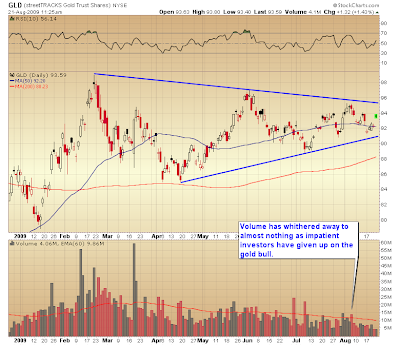
Before this C wave can break the $1000 barrier it needs to shed as many riders as possible. I've been saying for a while that that would happen either by gold scaring out investors or wearing them out.

In June it started to become apparent that we were probably going to see a large triangle consolidation thru the normal summer doldrums and so far that's what has played out.

It looks like gold has chosen the wear you out path. Volume has diminished to a trickle as impatient investors have given up on gold. And that's exactly what we need to see for the C wave to break through the triangle and ultimately through $1000.

I can tell you right now what is going to happen. Gold is going to get overbought. It will probably already be overbought when it breaks through $1000. Investors are going to start losing their position based on oscillators.

In a huge secular bull market and especially in a C wave advance that's starting to accelerate you will be much better off if you just take the oscillators off your charts. They are going to be your worst enemy.

We could and probably will see at least a 100% advance from the bottom of the B wave to the top of this C wave advance.

At some point gold is going to decouple from the dollar. Investors who insist on adhering to this inverse relationship are going to get left behind. Now I don't know whether that will occur with this leg or a later one but it will happen at some point in this bull.

Old Turkey still has the best game plan for investing in the gold bull.

Thursday, August 20, 2009

Inflation/deflation debate

The argument is that the massive liquidity creation by the worlds central banks is going to lead to inflation. The rebuttal is that there is so much debt weighing on the system that no amount of monetary inflation will be able to keep up with the deflationary forces. The banks aren't lending so all this liquidity can't find its way into the economy the deflationists claim.

I would tend to agree that the banks aren't going to be lending at least not at the insane level we saw a couple of years ago. I'm not so sure the liquidity can't find it's way eventually into the economy.

The government is spreading that liquidity around at a feverish pace. That would certainly be one path to get liquidity into the economy.

The other is a bit more obscure. We know the Fed is pumping trillions into the banking system. So if one was a bank would you rather allocate your capital towards risky loans in a weak economic environment where the chance of default is elevated or would you rather push that money into depressed assets, specifically the stock market?

It seems obvious the Fed is willing and probably motivated to create asset inflation in loo of real economic growth. Sure its another phony economy just like the one we had from 02 to 07 but it's the next best thing if aggregate demand can't actually be stimulated by simply printing money.

The Fed is hoping that eventually asset inflation will result in an real rebound in the economy. Unfortunately we've already traveled that road and what we ended up with was a credit bubble and soaring energy prices.

I suspect the end result isn't going to be any different this time than last except the collapse when it comes will probably be even larger as the monetary stimulus is multiples bigger this time.

Wednesday, August 19, 2009

Back into the consolidation zone


The market had every opportunity to breakdown but instead it has rallied right back into the consolidation zone of the last several weeks. The dollar on the other hand has had every opportunity to rally but instead its back below both the 10 and 20 day moving averages.

I'm not sure I would want to press the short side at this point. Actually I'm not pressing the long or the short side of the market. I have no desire to get tangled up in this mess. I'm just going to continue to sit with my precious metals and mining positions. They are the only things that I can honestly say are too cheap right now.

Tuesday, August 18, 2009

Cyclical bull?


At great many signs are pointing to a new cyclical bull market (within the context of a much larger secular bear). Not the least of which is the Dow Theory primary trend change. The fact that almost everyone believes that has me worried.

I'm going to go out on a limb and say I doubt it! I think what we are seeing is probably just the normal human response to the extreme negative sentiment generated last year as the market crashed (along with plenty of liquidity from the Fed and stimulus from the government).

In 2001 the events surrounding 911 caused an extreme downward move in the stock market. After the selling finally exhausted itself the market bounced back strongly taking two complete weekly cycles to roll over and make new lows.

In 2001 the market dropped about 23% below the 200 DMA. Last fall the market moved 40% below the 200 DMA. I think we are now witnessing the upside surge as human nature tries to swing as far on the upside as it did on the downside last year.

However, I don't think we saw a 77 month 4 year cycle. The longest in history was 66 months. I believe the 4 year cycle bottomed in March of last year and we are still in the most extreme left translated 4 year cycle in history. That means we probably have much further to go on the downside than almost anyone thinks at this point.

A rally with this kind of momentum probably isn't going to roll over and die easily. I suspect just like the rally out of the 01 bottom this thing is going to chop around for a while before finally breaking down and moving to new lows possibly by the end of Nov.

Thursday, August 13, 2009

Rule #1

Rule #1: Liquidity will eventually flow into undervalued assets.

This one is the simple reason why we see these long cycles of commodity and paper asset bull markets. At some point, because of human nature, one asset class will become extremely overvalued. We saw this extreme overvaluation in paper assets reach it's peak in 2000.

At that point smart money started leaking out of the stock market and looking for undervalued sectors. Areas with greater profit potential.

That sector was of course the commodity markets.

Now we are facing the consequences of the Fed's attempts to keep the paper markets elevated, a collapse in the financial system.

The Fed's response; pump more money into the banking system. We've already stood by and watched as they spent trillions of taxpayer money to keep the banks solvent. I dare say they've come to far to quit now.

Now I'm not one for conspiracy theories and I don't believe the PPT can rescue the markets even if there was such a thing. What I do wonder about is if the government, the same government that has pissed away trillions on failed banks, is going to allow the BKX to collapse again. You can see we just got a breakout above 44 and it appears to be holding. I have to wonder if this is going to be "allowed" to drop below that level again. The market is very sensitive to what happens to the financials.

I have to wonder if this is the reason John Paulson took a large position in BAC. It certainly wasn't because the fundamentals for financials are improving.

Now let me tie in the theme of this post to what I really want to point out. Let's say the Fed is pumping a constant stream of cash into the banking system. Rule number one is still going to apply, that cash is eventually going to make it's way out of the insolvent banks and go looking for undervalued assets.

Take a guess at what the single most undervalued asset is in inflation adjusted terms since 1980.

You guessed it, Gold!

Tuesday, August 11, 2009

Dilemma


We have quite the quandary developing. Everything from Dow Theory to the Coppock curve to the cross of the 50 day EMA above the 200 EMA is suggesting that we've entered a new cyclical bull market (within the context of a much larger secular bear market).

However that means that March would either have marked the single longest 4 year cycle in history at almost 7 years or we just saw a one year 4 year cycle. Neither one of those has very high odds of occurring since neither one of them has ever occurred.

Now you see why I have no desire to trade this secular bear market. This thing is going to throw every curve ball it can at investors. Any one who can make money in that kind of environment is just plain lucky. And counting on luck probably isn't a very dependable way to make money.

So the question is, did we just see the longest 4 year cycle in history and the trend is now up, or did the 4 year cycle bottom in Jan./Mar. of 08 and this is the single greatest, most deceptive bear market rally ever?

Friday, August 7, 2009

Dollar T1


I'm currently watching what may be a T1 pattern evolve on the dollar chart. The critical period is what happens as the dollar bounces out of the now due daily cycle low. If the T1 pattern is going to play out then the dollar shouldn't significantly move back into the consolidation zone.

Yesterday the dollar made a swing low and I would say the odds are very high that we just got the cycle bottom. Now we just have to see if it can re-enter the consolidation zone. If it quickly breaks back to new lows I would expect gold to take out the upper trend line of the triangle we've been watching and the C wave advance should be on in earnest.

Sunday, August 2, 2009

cyclical bull?


If we are entering another cyclical bull market within the context of a secular bear, similar to what we saw from 02 to 07, then I would not look for the leaders of the last bull to lead this one. They almost never do. It's obvious from the first chart that tech didn't lead the last bull and its not leading this one either (if we are starting another cyclical bull).

During the last bull from 02-07 the leaders were energy, base metals and financials with a couple of gadget makers thrown in.

That bull was based on the fundamental underpinnings of rising emerging markets, supply constraints in the energy & base metal sectors and a massive credit bubble that fueled the financial sector.

None of those fundamentals are now in play. This cyclical bull, if it does take hold, will be built on an explosion in the global monetary base.

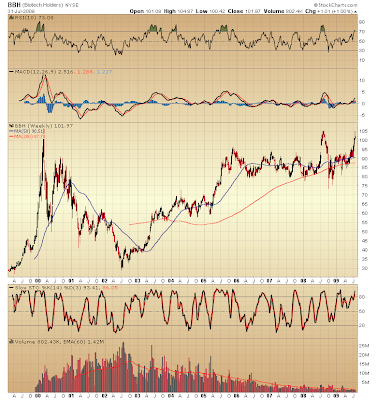
The one sector that stands to benefit the most from that fundamental fact is the precious metals sector. However there is another sector that appears to be leading already right along with the PM's.

Biotech!

I've speculated for some time now that when the next real secular bull market does start it will be based an advances in biotech. Perhaps biotech is just starting to position for it's role as the new technology of the 21st century.

Before we get too excited about biotech we need to get through this secular bear market first. That won't happen till we see true bear market bottom conditions. That means P/E's in the single digits and dividends on par with P/E's. It means the public turning completely against stocks. It means CNBC will probably be off the air. It means a Dow:gold ratio of 1 or lower. Until we see those conditions then stocks still haven't gotten cheap enough to represent true long term value.

In the long run that's how a secular bull market is born, by stocks reaching levels that represent incredible values.