Friday, August 31, 2007

1-2-3 Reversal

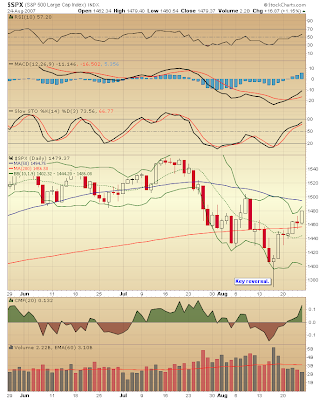
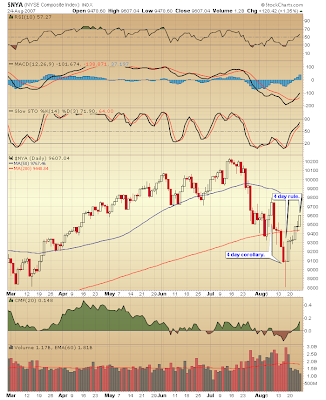
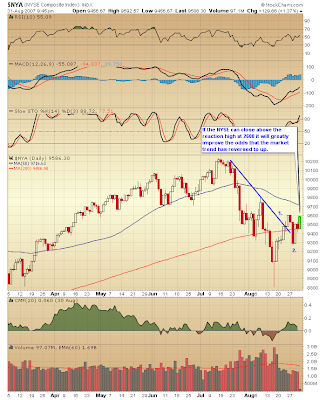
I will be watching the close on the NYSE today. If it can close above 9600 it will have completed a trend reversal according to Victor Sperandeos 1-2-3 reversal rules. If so the test of the lows at #2 was very weak. If that's all the test we're going to get out of this correction then this is one very powerful bull market IMO. We'll have to see how the market closes.

Thursday, August 30, 2007

Fed rate cut

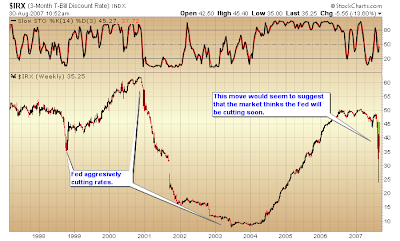
Money is again rapidly flowing into the 3 month T-bill. As we can see in the past this has been followed by a cycle of Fed rate cuts. The last week this strong flow of money into T-bills was a sign of fear as investors wanted out of riskier assets and into safety. The last 2 days so far the market has been strong so I'm of the opinion that the market is seeing a rate cutting cycle ahead. Apparently the market thinks this will be a positive for the economy and stocks. Well either that or the credit markets are bracing for another round of selling and the stock market doesn't know what it's doing.

Wednesday, August 29, 2007

Head & Shoulder Pattern

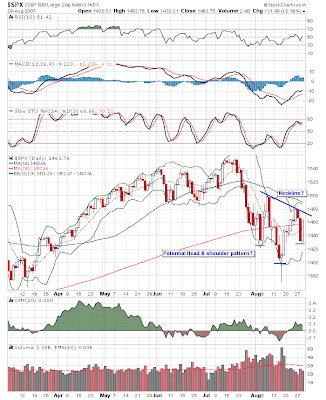
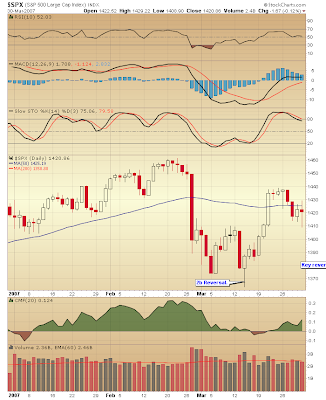
OK here's my pitiful attempt at a pattern analysis. It looks like we may be forming an inverse head & shoulders pattern. LOL Actually what I'm looking at is a potential 1-2-3 reversal with the big key reversal day and a very weak test of the lows. If the S&P can close above the reaction high then it will have completed the trend change back to the long side. Does this guarantee the market is going back up? Of course not there are no guarantees in the stock market but it does skew the odds a little more in favor of the bulls. Also yesterdays 90+% down volume day was the worst in 10 years. The last four times we saw anything similar in the last decade it has been followed by an average weekly gain of 4.9% and a monthly gain of 6.2%. 4 out of 4, that's pretty good odds. Combine that with the COT at historic long positions, insiders backing up the truck and short interest at record levels and those are the kind of odds I refuse to pass up.

Monday, August 27, 2007

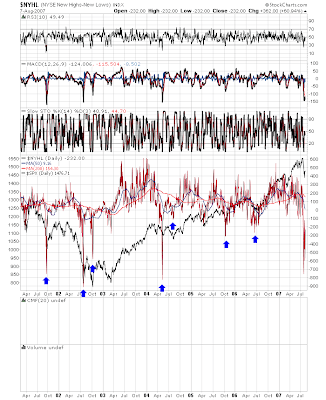
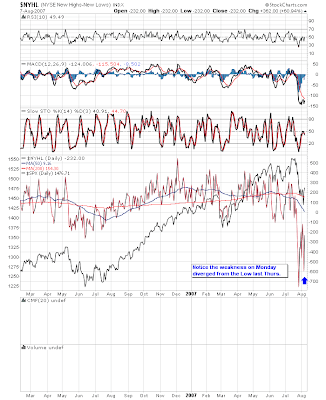
New lows

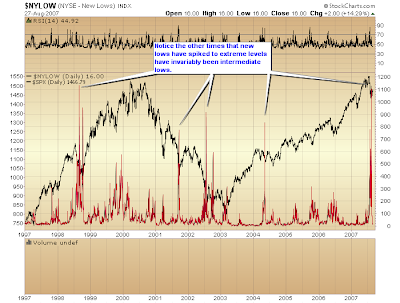
I'm going to point out just how unusual the breadth extremes were the week before last. The only time in the last 10 years that have seen new lows on the NYSE spike higher was the bottom of the 98 decline. On Thursday Aug. 16th the new lows hit 1132. There are 3453 stocks traded on the NYSE. That means 1/3 of all stocks on the NYSE hit new lows on Aug. 16th. That is a sign of extreme panic. I think we've all learned by now that panic is almost always an opportunity. We all know that the market reversed big time on that day and then rallied big the next day. As a matter of fact the next day was a 90% up volume day. Most intermediate rallies start with a 90% day. I strongly believe we saw the internal low for the decline on Aug. 16th. As of today the new lows have totally collapsed back down to 16. We may very well see the market drop again and new lows may move even higher than 1132 but let's just say I have strong doubts as to that happening. If the market holds here then we should have hit such an oversold level that the ensuing rally could be quite impressive and that's exactly what the historical precedents would suggest.

Technical Analysis


I've had a few requests to do a post on how I use TA. Here goes. First off let me say to a great extent I look for TA that will confirm the COT position. So yes I have a bias. Don't we all? Mostly I'm looking for reversals that signify that the selling or buying has dried up. I have a strong preference for the 2b reversal. I also look for the 4 day rule and 4 day corollary after long intermediate moves. Mostly I'm looking for levels of supply and demand. I will use indicators such as RSI, MACD and Stochastics as a secondary indicator if they confirm the COT position but definitely not as a reason to trade against the big boys. I almost never pay any attention to patterns personally such as head and shoulders or bear flags (whatever the hell that is). I particularly like the point and figure charts because they take out everything but the price action and levels of support and resistance are pretty obvious. I try to keep it as simple as possible and not overthink my trades. If the COT is long I look at the indicators to confirm that position. If it's short I look for indicators that would suggest that the market is or has turned down. Pretty basic stuff really.

Saturday, August 25, 2007

Emotions

Emotions. We humans are blessed with them. Of course on the flip side we investors are cursed with them. Fear and greed. The two emotions that make the markets go round. Emotions were put on full display week before last, at least the fear emotion. This week the greed emotion started to come back or maybe it was just his younger brother Hope.
Ever notice how easily these two can change places in your brain? Heck sometimes they can flip flop back and forth several times a day. Now look back at some of your past trades and notice how many times these two emotions made you take the wrong trade. I've said several times over the last week that we should be getting a pullback. So far it hasn't happened, but it will since nothing goes straight up. Right now greed is feeling pretty good but I guarantee that as soon as we have one down day fear is going to jump right back on your head and greed and hope will go right out the window.

So how do we control these little devils that make us act irrationally? In case anyone hasn't noticed irrational behavior isn't real good for your portfolio.

There are a couple of ways. First and foremost we trade with correct position size and we expect the worst. That way if a trade does go against us we don't have so much at risk that if it hits our stops it will do serious damage. If you know ahead of time that even if the worst happens you're not going to lose most of your life savings then it is much easier to keep your head when everyone else is losing theirs. (I got news for you when everybody else is losing their cool that just means they're going to do something stupid and hell if they're going to do something stupid you might as well profit from it) However if you are one of the sheep running with the herd then you're not in any position to take advantage of anything. As a matter of fact your probably to busy getting fleeced.

The second thing we can do is learn discipline. That means when you've got the odds in your favor then play them. Ever heard a pit boss at a casino ask a blackjack player to leave the table just because he's on a lucky streak? Hell no. In fact what happens is that player will start getting all kinds of comps. Now why would the casino do that you ask. He's taking their money. Well obviously the casino knows that the odds are in their favor so all they have to do is keep that player there and eventually the odds will "fix" that little winning streak. It's exactly the same with investing. As long as you trade with the odds in your favor they will eventually "fix" any losing streak. That is as long as you believe me about rule #1.

Now trading with the odds can mean many different things. There are probably 1000's of ways to make money in the markets. I've posted the three that I've found work the best COT, VTO and Bollinger Band crash trade. All three have a positive expectancy and if consistently traded with discipline and correct position size will produce a long term gain for your portfolio. That's not to say there aren't other systems that will do as good or better. I'm all ears if anyone wants to post their systems BTW. However for these systems to work you've got to take the trades when they setup. You've got to have the discipline to stick with them and you've got to be willing to take a loss since no one knows before hand whether a trade will be a winner or a loser. If you're not willing to let the trade work then you will cut your profits short. All trades have some BIG winners. If you are nervous and take your profits too soon then you will never allow a trade to produce a big winner. By so doing you usually change a positive expectancy into a negative one.
Friday, August 24, 2007

PPT

I've been trying to refrain from touching on this subject because I know it's going to spark a lot of controversy but here goes. Get this through your heads there is no plunge protection team, period. The markets are just way to big for anybody to control and that includes governments. The market is bouncing right now and I'm seeing all over the blogosphere the "PPT " used as the excuse for why the market is rising. First off if you believe in the PPT why in the world would you be short? Second if there is such a thing as the plunge protection team which supposedly was created by Reagan after the 87 crash then explain to me how in the world we could have had the 2000-2002 bear market. I'm all ears. If any one can answer those two questions with any kind of logical answer I'll consider the existence of the PPT. If not then quit blaming your losses on some imaginary group and take responsibility for your own mistakes. Jeesh it just amazes me the things people will come up with to try and rationalize why losses are not their fault.

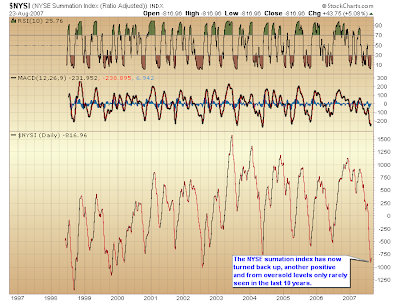
Summation index

The Summation index has now turned back up. There have only been a few times where this index has gotten more oversold in the last 10 years. One was 98. While there could be another drop the odds are against it and if it does happen the data would suggest it won't drop significantly below last Thursday before a rally ensues. As I've mentioned before these declines that come at the very end of a long multi year rallies tend to be very swift and very scary. Does anyone think that's an accurate description of what we just went through? These kind of corrections historically recover very quickly. The declines that do the real damage are the ones that start early in the cycle and just slowly hemorrhage for months or years. Remember 2000-2003 or for some of the older investors 1973-74. I have a feeling the next cycle is going to be one of those nasty ones.

Wednesday, August 22, 2007

Bullish Percentage Charts


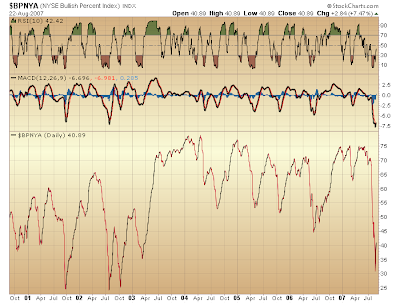
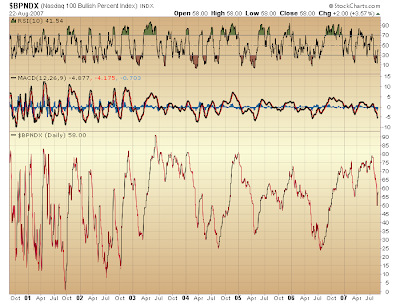
I like to keep tabs on the Bullish Percentage charts. I know many of you are familiar with my 5th year scenario. All that amounts to is that normally bull markets can't make it passed a fifth year without a large decline. One of the things I was going to be looking for to indicate that the fifth year decline was playing out was an oversold reading on the Bullish percentage chart. Something in the 30 or lower range. Well the NYSE so far has bottomed at 30.99 and has now turned up and is back above 40. All this means is that only 30% of the stocks on the NYSE were in bullish trends on the point and figure charts. That's an incredibly small amount of stocks in bullish trends. If this rises back above 50 it will be just another positive sign for the market. Now notice the second chart of the Nasdaq 100. It was much stronger than the rest of the market and never even came close to oversold. That should not be happening in any serious decline. The Nasdaq should be leading the charge lower. Notice how it lead last year. It is entirely possible that we just got the 5th year decline and the pitiful 10% is all the market is going to give back. This seems hard for me to believe but a great many indicators other than just the BPNYA also signaled extreme oversold levels rarely seen and usually only at very important lows. Of course we still have the fact that the commercials are at historic long positions. Oh and in case anyone hasn't noticed the current long signal is still profitable so far. As a matter of fact everyone just got a second chance to get in at a lower level than the original signal and you still have a chance to get in at a level very close to the original even at today's close. Ah but after experiencing what we just went through will you now be able to pull the trigger? Buffett did. Lambert did. Gates did. Soros did. Altucher did. Ah what the hell do they know anyway.

BTW if you do pull the trigger here will you immediately sell for a loss if the market drops to test the lows?

Russell

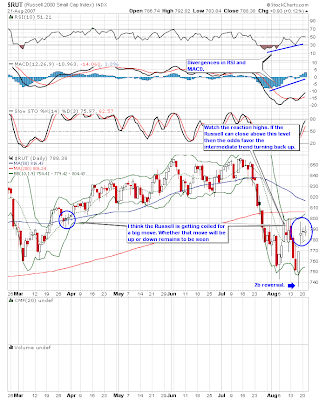
The Russell appears to be getting coiled for a big move. I have no idea whether that move will be up or down however. There are some positive signs however. Note the 2b reversal and the divergences in MACD and RSI. Also notice the 4 up days in a row. Remember the 4 day rule?
here is a post describing the 4 day rule for any who are new to the SMT. I'm watching the reaction high. If the Russell can close above that level then the odds are good that the intermediate trend has turned back up.

Sunday, August 19, 2007

Inflationary cycle

I just ran a quick study of the number of players in both the gold and oil futures markets with some interesting results.

First off let me lay a bit of groundwork. In the 70's we were in a similar situation as today. We were fighting a very expensive war and we had entered a commodity bull cycle. Now wars are almost always paid for by governments printing money or inflation if you will. This time around is no exception. The value of the dollar has gone from 120 to 80. Seems pretty obvious the United States government is opting for the standard payment method. After a 20 year bear market in commodities the bull cycle has started again because supply and demand are out of balance. When that happens prices rise until balance is restored. The problem with commodities is that it takes time to bring more supply on line. While this time passes prices continue to rise. The most important commodity and the one the whole world is totally dependant on is oil. There is no substitute. When a government opts for the printing presses in order to pay for a war it exacerbates commodity inflation because these excess dollars eventually find there way into hard assets that are already in heavy demand. More than anything else when the price of oil spikes economies take a hit. Classic 70's markets follow. Spikes in oil price followed by economies in turmoil and repeating bear markets. So unless the powers that be are stupid and I don't think they are this time around they need to keep the price of energy reasonably in check or face the same outcome as the 70's.

Now back to my study today. I've noticed that the total number of participants in the gold futures have remained steady for the last 5 years. Not so for the oil markets. They have been increasing steadily since 04. Have we all of a sudden had a bunch of oil companies and refiners spring up that need to hedge production forward? As far as I know we haven't built a refinery in 30 years and we haven't really seen a flood of oil companies coming into the market. There seems to be mostly the same ones that have been around for years. Actually quite a few have merged. So where is all this extra interest coming from? I'm just guessing here and I may be totally off base but when we saw Goldman rejigger their gasoline weightings last year to bring down the price of gasoline I got the feeling that governments are going to try to control the energy markets this time around and hope for a different outcome than in the 70's. Let's hope it works because if any of you happen to remember the 70's and early 80's weren't the best of times

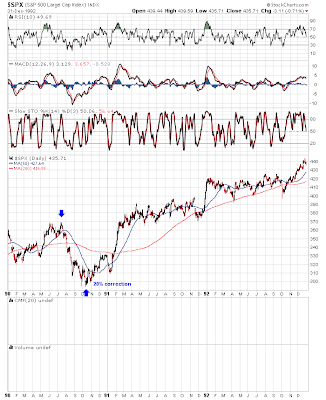
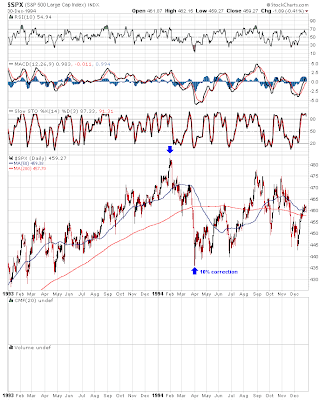
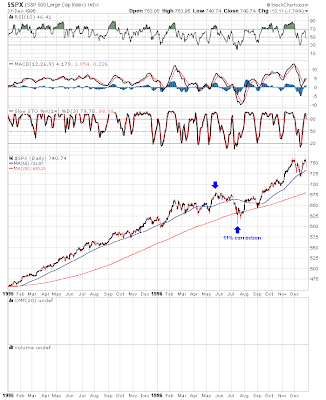
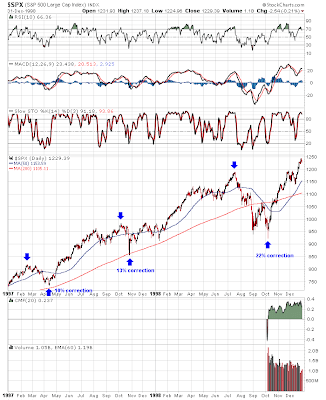
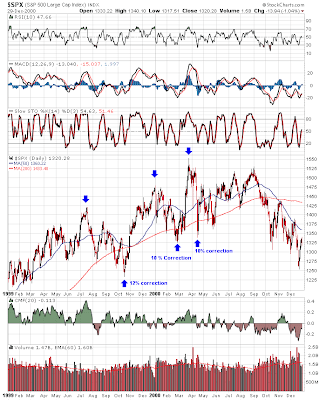
10% corrections


You're looking at 10 years of bull market history. During that 10 years we saw 9 10% corrections or better. 10% corrections don't seem to be all that unusual. For all the panic lately you would think something incredibly out of the ordinary had happened and maybe something extremely rare will happen but as of right now this just looks like the same old thing we've seen happen many times in the past. As a matter of fact at the moment it looks extremely tame when you consider the financial Armageddon rhetoric being thrown about. If 10% is all the market can muster with the credit markets locked up then this has got to be one of the strongest bull markets in history. The last time we had a financial meltdown was 98 and the market managed to drop 22% before common sense came back and the world realized the sky really wasn't falling.

Saturday, August 18, 2007

Second Chance?


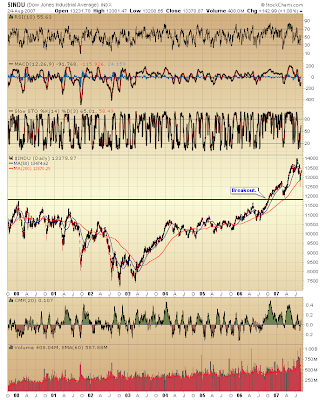
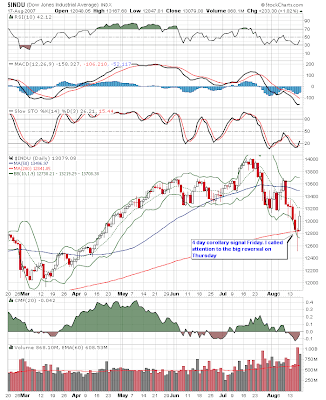
First off let me point out the 4 day corollary signal that was given by the Dow on Friday. For any who are new to the site here is a post with explanations on the 4 day rules. Also take a look at the long tail in both charts. Normally a strong sign of a bottom. On top of that we had a 90% up day the very next day. Many intermediate declines end on a 90% up day.

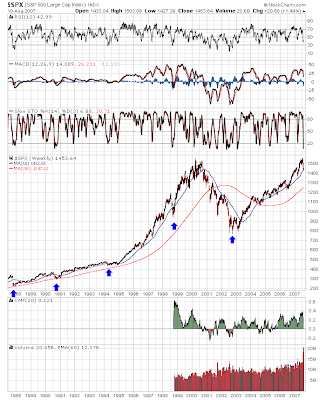
Now let's move on to the next chart of the S&P. For all the people who missed the original long signal back in Mar. well you just got a do over. As of Friday the S&P is right back at the level where the Mar. signal was given. Now let me make a few things clear. First off your odds on any COT signal producing a winning trade over the last 21 years are about 3 to 1. If you were to just take long trades they would be better than 3 to 1. Next and I've repeatedly called attention to this the commercials are not just long they are at massively historic long positions. The little guy is at almost historic short positions. Insiders are buying like there's no tomorrow and there's only one reason for insiders to buy. Now lets throw out a few more statistics. Breadth extremes like we've seen over the last week or two have only occurred four times in the last 40 years or so. Every one of them was followed by extremely powerful rallies.

I've said this many times before that if you can get the odds in your favor then just like a casino you will make money in the long run. Having said all that and shown you that the odds are very heavily weighted to the long side and the technicals are also suggesting a bottom how many of you after all the volatility last week have the balls to pull the trigger? Let me point something else out. Your stop would be a break below the recent lows. The four times in history where we saw these kind of conditions the panic lows where not violated. So to make it simple your maximum loss if you put your intire account (which I better not catch anyone doing after all my rants about position sizing) is 5.5%. Your potential gain if we just go back and match the highs is 6.8%. Of course if the market rallies powerfully as has been the case after such extreme oversold levels then your potential gain could be much more than 6.8%.

So the odds are in your favor and the risk reward is in your favor. It doesn't get any better than this in the markets. So I'll ask again how many when presented with all these factors in your favor have the courage to buy here? My guess is few and here's why. Too many investors are more concerned with being right than making money. I've just explained to you that if you consistently trade with the odds in your favor you will make money in the markets. Not you might make money in the markets. You will make money (well as long as your position size is sane). That doesn't mean that you won't lose from time to time. You will. This could be one of those times even with everything in your favor. My guess is the extreme volatility we've just experienced and the fear of losing will prevent all but the most experienced and disciplined investors from buying here.

Friday, August 17, 2007

COT report

The COT is again a bit more bullish than last week. The commercials are now back to doing what they do. They bought as the market went down.

Today I want to talk again about how I look at the COT and some of the mistakes that I think people make.

First off just because the commercials are long it doesn't mean that every commercial trader is long. I read posts that seem to suggest that investors think that since the COT is bullish then all the commercial traders are long and taking a beating during this decline. At any one time there are usually just about as many commercials shorting as there are buying. What I look at is the net position or the longs minus the shorts. There will usually be a difference one way or the other. When that difference swings a little bit too far in one direction then I start to look for a trend change. But just because the net is tipped in one direction that doesn't guarantee that the market will move in that direction. All the COT is saying is the majority of the commercial money thinks the market will move in a certain direction. That doesn't mean that the majority can't be wrong. It's just like a casino. The odds are in their favor but that doesn't mean that the occasional gambler won't win. But by having the odds in their favor a casino does guarantee that they will make money over the long haul even if they occasionally have a losing day or week. That's all I care about is will a system make me money over the long haul not whether every trade will be a winning trade.

Position Size

I just got an e-mail from a subscriber and it prompted this post. The key to making money in the stock market has nothing whatsoever to do with being right or wrong. It's all about position sizing, period. If you never listen to anything else I say, If you think the COT is junk, if you hate every strategy I've ever posted that's fine. If I can make you believe me on position size then I will have done you the greatest service anybody could do. First off let me say the best thing you can do is ignore all these idiots and their leveraged options crap. Options can be great tools when used properly. You can control risk wonderfully with options. However I suspect almost everyone uses them for leverage. When used for leverage especially large leverage then you're almost guaranteed to destroy your account. Many newbies are wrapped up in making the correct call. Making the correct call is meaningless in the long haul. It's not about how much you make. The key to making money in the markets is how much you lose when you have a losing trade, period. Sure the COT is down 2-3% on this particular trade. So what? It's up 50-80% over the last 4 years. I don't know about you but I'm willing to trade a small loss occasionally to make those kind of returns. I also know that no system can win every time and I don't need it to win every time just more times than it loses. If it does that then in 10 years I'll have a lot more money than I do now. I guarantee someone who trades emotionally and with too large of a position size will be gone 10 years from now. You decide whether you want to be here in 10 years or not.
Thursday, August 16, 2007

VIX

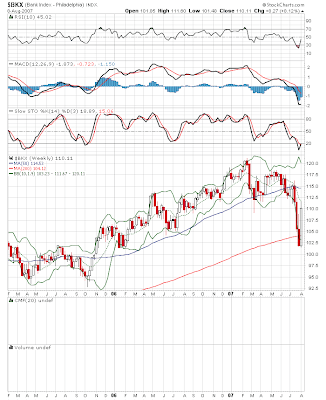
The Vix is fast approaching levels that have signaled 4 year cycle lows in the past. You can't see it on this long term chart but the VIX has jumped from 22 to 32 in 5 days. At the rate this market is moving it could reach the 40's in one or two days. That should produce the kind of panic that signals major bottoms. That's not to say that we couldn't get a serious drop yet. I'll say it again these kind of waterfall declines are normally corrected rather quickly, similar to 90 & 98. That being said if you can't stand the volatility simply stand aside until things calm down. They will calm down they always do. This isn't the end of the world anymore than any other highly volatile time in the market. What I do know is that emotional selling will always create bargains, always! I'm looking at the PM myself.

Tuesday, August 14, 2007

Fed & Inflation


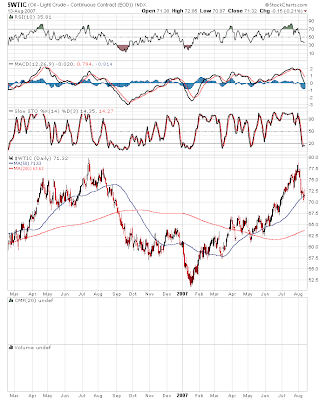
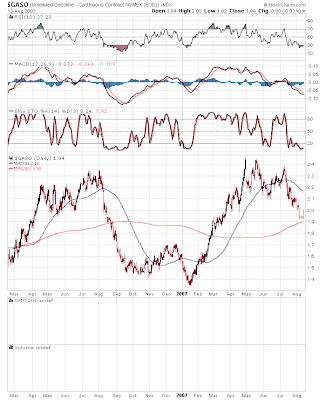
I've mentioned this before. You need to watch what the Fed does not what they say. If they were really determined to control inflation they would have continued to raise rates last summer when the had the commodity markets deflating. Instead they buckled to political pressure and quit raising rates. Look at the charts above and you tell me if inflation is under control. Now they have a real problem. They can't raise rates because credit markets are in turmoil. If the pressure from the politicians gets hot enough I suspect they will start cutting. If the economy starts to sour the incumbents can expect to get booted in the next election. I suspect the powers that be are already feeling the temperture rising what with the stock market declines coupled with the heat in the real estate markets. I wouldn't be surprised if sometime in the near future the Fed starts lowering rates.

Sunday, August 12, 2007

4 year cycles

I'm no master at cycles but even a dumby like myself can sometimes spot the obvious. The four year cycle in the stock market has been around for about the last 100 years or so. I've noted the last five cycle bottoms on the chart. During a multi year secular bull market most of the 4 year cycle tops tend to be extremely right translated. All that means is that the top tends to form very far into the 4 year cycle. Examples 87, 90, 98 and it looks like this 4 year cycle will also be extremely right translated. These cycles tend to be short and vicious but they also tend to be corrected fairly quickly. Ex. 90 & 98. The cycles that do the real damage tend to be the ones that are left translated. Ex. the cycle that topped in 2000. It just bled investors to death for almost 2 1/2 years and has taken 5 years to recover from. The current cycle will most likely be the quick nasty type. These usually result from some kind of scare that seems much worse than it really is thus the market recovers rather quickly when it comes to it's senses. The left translated cycles are normally a sign of a deteriorating business climate. Ex. the spike in energy in 2000 coupled with the fact that the market had to grasp the fact that many dot.coms were never going to make the kind of money it would take to justify the valuations at the time. Then of course 9/11 dealt a serious blow to the economy. What transpired was a slow death of sinking stock valuations followed by sharp counter trend rallies that would inspire just enough hope to keep most investors holding and hoping.
I suspect this 4 year cycle low will be similar to 98 short and nasty. Heck we may have seen the lows already and then again maybe not. However when we do put in a bottom I don't think it will take the market long to gain it all back. Just look at last week for instance. It only took the market 3 days to gain back over half the losses that it took 3 weeks to lose. However I also suspect that the next cycle will be a left translated cycle and will do some serious damage similar to the 73-74 scenario. I also have a feeling it will be brought on by a surge in inflation specifically energy prices. If the Fed ends up lowering rates to appease the politicians they will be laying the groundwork for increasing inflation in the coming years. If so then we can start getting used to even higher commodity prices and stagnating growth. Hmm...I think I'll buy some more silver and gold now that I've just scared the bjesus out of myself.
Saturday, August 11, 2007

2b reversals


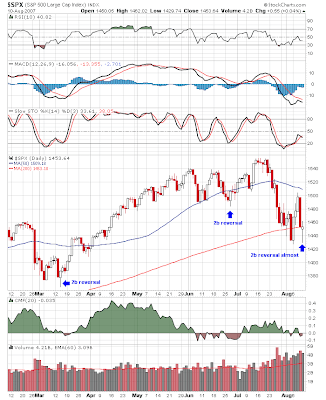
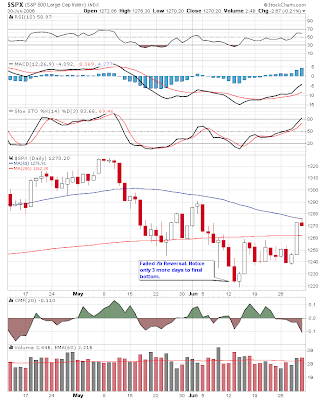
Some current examples of 2b reversals. These are by no means 100%. I've never actually tested to see what kind of % can be expected from a 2b signal. If I had to guess I'd say maybe 55-60%. The Dow actually did signal a 2b on Friday along with the NYSE. Just something to think about if you are trying to press the short side. The odds may be slightly against you. It might not hurt to cover and see if the 2b is negated before pressing the short side anymore.

COT loss and Draw down


“Contrary to what 99% of the investment population thinks, trading is not about being right. Being right is easy. Trading is about being wrong; and navigating this inevitable occurrence distinguishes winners from the losers in the long run.”– Fari Hamzel
I love that quote. It is so true also. It's not how much you make it's how much you lose that determines whether you make money in the markets. Most investors think being right on their trades is what determines whether they make money or not. Nothing could be further from the truth. Any experience trader will tell you that the best you can do is maybe 3 to 2 in the market. (The COT has a history of 3 to 1). So it all boils down to your position size on your losing trades as to whether you will ultimately make money over the long haul. First I'm going to use an example that I think is probably playing out right now.
The bears have been consistently wrong for several years so I'm guessing they are currently betting huge trying to make back all their losses quickly. It may very well work but here's the rub. If they don't have the discipline to use correct position sizing now then they aren't going to use it when the market turns against them. The outcome is they will eventually lose all the profits that they are making from the current fall. It is the same as a gambler sitting in the casino. He catches a winning streak and makes some good money. Does he pack up and go home? Let's just say that living in Vegas I've never seen it happen. What I have seen is the gambler starts raising his bet because he's obviously hot right now. Then he loses a couple but because he was betting big he just gave back a good chunk of his winnings. Now he's pissed and wants to make that back so he keeps betting big trying to get back to where he was. We all know where this is going don't we. Yes he gives it all back and then some (usually "then a lot").
Does anybody seriously think that this mentality doesn't play out exactly the same way in the stock market? BTW I guarantee it does. I've seen the horror stories on the blogs.
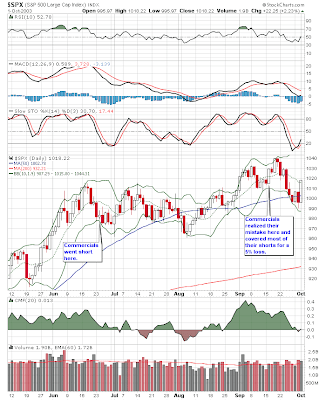
Now I'm going to walk you through a losing COT trade and a draw down.
First chart the commercials flipped to an extreme short position on June 24, 03. The market started to drift down but then began climbing in Sept. The commercials realized their mistake and covered most of their shorts for a 5% loss on Sept 16th. If you were watching your position size you maybe lost 3-4%. 5% if you went all in. 5% is easily recoverable.
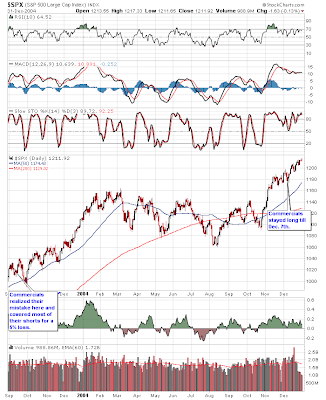
Now let's look at a draw down. The market appeared to have topped and rolled over in the beginning of 04. Common sense and the charts said the counter trend rally was over. But for some reason the commercials didn't dump their longs and go short here. Well with hindsight we can see why they didn't abandon their position. They weren't interested in shorting for a measly 8% gain they were too busy accumulating stocks for the multi year run that was to follow. I have found that most of the time when the commercials stubbornly stay on the wrong side of the trend it is because they are accumulating or distributing stocks. Right now it would appear that the commercials are accumulating like there's no tomorrow.

Friday, August 10, 2007

COT report

Not much change in anything this week. The commercials added a few shorts in the S&P contracts but more than made up for it in the combined contracts. All in all they added about 1.5 billion to the long side. It still appears that the big boys think this is a buying opportunity. There's been much discussion lately that the commercials are hiding their hedging in black pools. While I must admit it is possible I've also noted that the open interest hasn't declined in recent months. It would seem reasonable to expect that open interest would decline if the commercials were all of a sudden taking their business elsewhere. It doesn't seem reasonable either that they are spending billions in the futures markets just as a decoy to hide what they are doing somewhere else. All in all the most reasonable explanation is that nothing has changed and the big boys just think the global expansion is still intact despite the temporary problems in the credit markets.

Thursday, August 9, 2007

Anatomy of a Bear Market

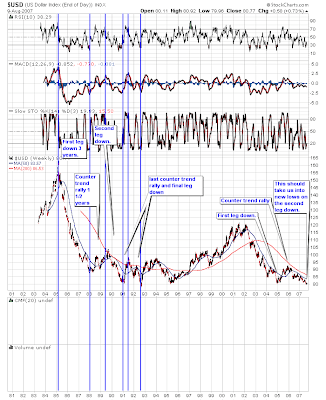
What we're looking at is the bull bear cycle for the US dollar. Notice the three legs down. Most bear markets have at least three legs down some more. the Nikkei had multiple down legs. However applying this to the present situation we see the initial decline in the dollar lasted about 2 1/2 years. Sound familiar? Then we got the counter trend rally from the beginning to the end of 05. We are now in the process of the 2nd leg down which should take the dollar index to new lows. Actually it already has taken out the 05 lows. I suspect it will continue down much more even though the 2b reversal from last week may mean a bit of a bounce here. When this decline really starts to roll into new lows gold should move much higher to put it mildly. Again if gold can push past the old high of $880 then the average gain has been 140%. Patience is the word of the day for PM holders. Our time will come and probably sooner than later.

Wednesday, August 8, 2007

Housing and Financials


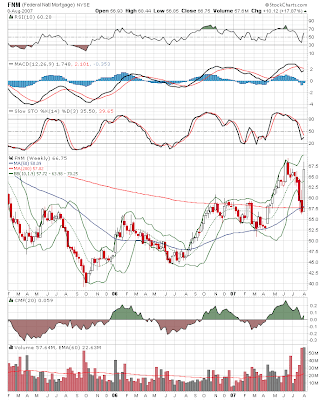
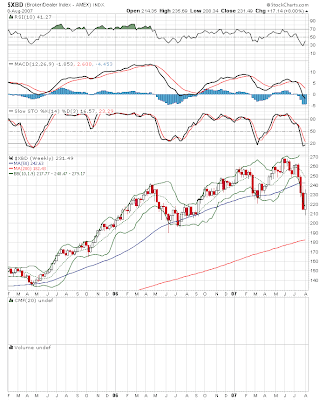
Anybody will tell you that you've got to sell housing and financials nowadays. It's common knowledge right. I mean it only makes sense real estate is done and the financials are going to collapse because of subprime and Alt-A loans. Even Cramer can tell you that you've got to get rid of anything in this sector. Well let's take a look at the charts. The S&P is up 4.50% in the last 3 days. Pretty sweet. But wait a minute housing is up over 8%, FNM is up over 17%, the banks and broker dealers are both up over 8%. What the hell is going on? I thought these two sectors were toast. This very well could just be an oversold bounce heaven knows they've both been punished recently. However let me lay out another possibility. The panic selling the last couple of weeks may just have put some very good companies on sale for half price. Sure subprime is a problem but it won't last forever. I dare say most if not all the large banks are going to take some heat but I doubt that any of them have sustained irreparable damage. Perhaps people that don't necessarily follow the herd realized the other day that Mr. Market just threw them a slow ball right over the plate and all they had to do is swing. Maybe those same people also noticed the 10 year yield was back down around 4.75 which is good for the housing sector. Maybe those people also think that even though the housing sector is in trouble I doubt it is finished as an industry. You might also notice that the housing sector has been in decline for 2 years now. Remember how I noted that initial legs down in bear markets usually last about 2- 2 1/2 years. With all the rotten news in the real estate and financial markets these two sectors are moving up strong not sinking. This is how major bottoms are put in when the market can't go down anymore even on bad news. I think these two sectors bear close watching in the coming weeks.

BTW if you had been brave enough to take GS the other day when I pointed it out you would now be up over 7% in three days. 2% better than you could do in treasuries all year.

VTO and Bollinger band crash trades


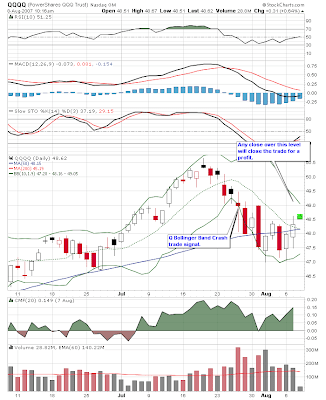
There are several VTO and Bollinger band crash trades that may close soon. The Q bollinger band crash trade signalled at $49.00. Any close above that will signal a profitable exit. The VTO is also still open. Any close above $152 on the SPY Bollinger band trade will signal a profitable exit. VTO trade is also still open here. The third chart is the weekly Bollinger band crash on the SPY. If the close on Friday is above the open last Monday we will also have a profitable trade here. The weekly VTO is also still open. Last week I imagine many investors probably exited these trades thus guaranteeing a loss. Now do you see why discipline is so important. If you are going to take these trades then you MUST be willing to take a loss otherwise you won't hold on for the winning trades. If you don't follow the rules of the trade you turn a positive expectancy into a negative one.

NYSE High/Lows


You can see from the first chart how unusual the the breadth extreme was during the recent decline. In the past these kind of extreme spikes have signaled the exact bottoms. The only exception was the 04 period. However there was a strong rally after the 04 spike down. Now look at the second chart. This signal was slightly different than other spikes in that the market moved down into a lower low but the NYHL diverged and made a higher low. The odds seem to suggest that we've probably made the low or at the very least we should bounce strongly before the market can work lower again.

Tuesday, August 7, 2007

COT current level


The current long position in the COT is historically the largest ever. Looking back the only two times that the COT reached bullish levels similar were in 94 and Oct. of 99. As you can see the outcome was fairly positive on both occasions and that's a bit of an understatement.

Monday, August 6, 2007

Goldman Sachs a Guaranteed 30% return

Yep you read it right! A guaranteed 30% return if you were to buy GS right here. How can that be you ask it looks like its in free fall. Notice I didn't say a guaranteed 30% return in the next month or even in the next year. But if an investor is willing to buy and hold GS and willing to believe they will survive the current turmoil in the credit markets without going bankrupt then I guarantee they will be back to making new highs some time in the future. When that happens you will have earned 30% on your investment. Even if it takes 3 years for them to get back to the highs you would still make 10% a year which is double what you can get in treasuries plus you will get a .70% annual dividend. It is possible you might have to hold through a draw down on your investment but eventually GS IMO will be back to making tons of cash and the market will see that whenever this current crisis passes and it will pass, they all do eventually. Panic like what we are seeing now creates opportunities. If you can keep your head and think rationally you can find great companies that are being put on sale for no other reason than human emotions are running amok. This is how investors like Buffet, Soros and Greenblatt think. Is it any wonder they are billionaires.
PS If you think BSC will also eventually survive the present situation then you could guarantee yourself a 50% return.

Sunday, August 5, 2007

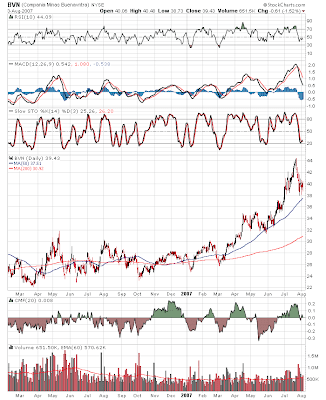
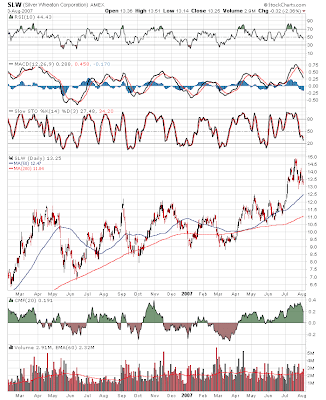
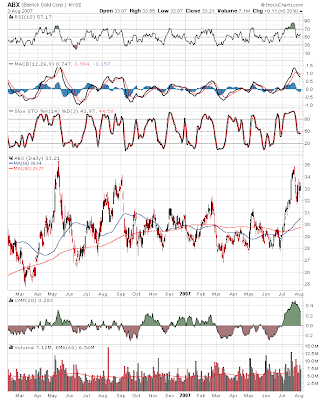
Gold and Silver stocks


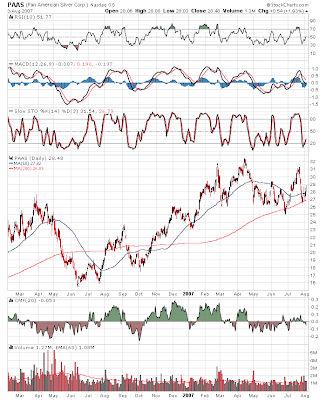
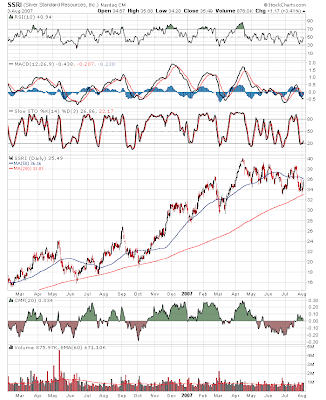
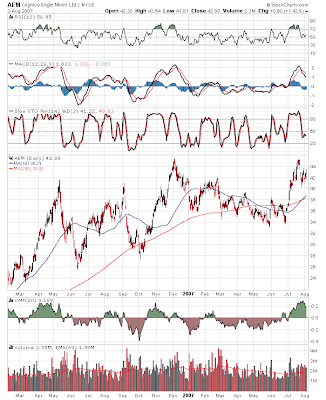
I thought I'd post a few gold and silver stocks here and in the previous post that I think may be leaders if the PM market is ready to embark on another leg up. Most of these are in long term uptrends, the 200 DMA is ascending strongly and the 50 DMA is above the 200.

Gold and Silver stocks