Thursday, April 30, 2009

666 & 888


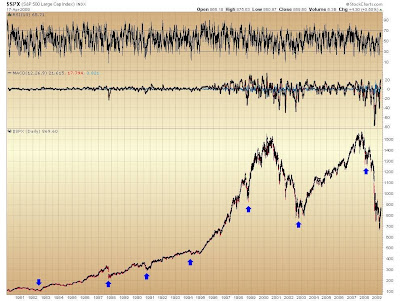
Today's intraday high of 888 puts this rally in second place for all time greatest bear market rallies in history. Only the bounce out of the 29 crash was greater. How ironic would it be if the rally started at 666 and ended at 888?

Wednesday, April 29, 2009

I'm back

I'm back and sort of in one piece :-) After a much needed vacation, I'll be back on schedule starting tomorrow.

Monday, April 27, 2009

Monday Apr. 27th


Just a couple of quick comments before I head back down to the Canyons.

I'm beginning to think that Monday may have marked the last daily cycle low and the short term rally we are seeing may end up being a failed and very left translated daily cycle. We'll just have to see how it plays out as we are still in the timing band for a daily cycle low.

The swing low today on the dollar probably did mark the most recent cycle low. If the dollar continues higher from here it's going to add pressure on the stock market. As if all the negatives I've gone over for the last couple of weeks aren't enough?

It's hard to see in the chart but MACD has now crossed over and is heading higher for gold while the opposite is true for the S&P. I've got to say I would rather buy into a correction that's running out of steam (gold) than a counter trend rally that's starting to fade (S&P).

Finally a look at the gold bull from the beginning. I've shaded the first two phases of the bull market. I think there's a good chance gold is just now starting the third speculative phase. Once gold closes back above $1000 I think it's going to be game on, so to speak.

One thing I did want to point out was the size of the last two C waves. Both were proportional to the preceding consolidation and both lasted at least a year. Notice that both also formed a midpoint consolidation about half way thru the rally. I suspect we will see something similar this time to.

The size of the current consolidation suggests this C wave should take gold to $1500-$2000.

One can fight with the bear market in stocks if they are so inclined but the easy money will always be to just take a position in a bull market and hold on.

Personally I have no desire to try and second guess the volatile swings in the stock market to make tiny profits (if I'm lucky) when I can get rich by just taking a position in the gold bull and holding on.

Heck its a lot more relaxing being outside climbing everyday while I let the bull do it's thing than glued to my computer trying to scratch out a dollar here and there fighting with a bear market.

Besides I guarantee that market timers, even the really good (or more likely lucky) ones are never going to make even a fraction of what one will make by just riding a bull market to completion.

Still climbing

I'm still in UT climbing and currently planning on returning Wed. If I get back early enough I will try to get an update out to subscribers Wed. evening. If not I will be back on schedule Thurs.

I am going to have access to a public computer for most of the day today so I will be able to answer emails and I may post a comment after the market closes today if there's anything worth saying that I didn't already say this weekend.

Saturday, April 25, 2009

stocks


As I said in the previous post I'm having too much fun to come home. Seriously, only an idiot would think this is fun, but I do and apparently I am. I may stay an extra day or two as the weather and climbing partners are excellent. The fact that I'm knocking off project after project is also making it difficult to head home right now :-)

Continuing on to the stock market. The first thing I want to mention is the selling on strength data has now reach -620 million. Granted this isn't always a perfect timing mechanism but this kind of selling has almost always led to an intermediate top in the past.

Add to this the fact that insiders are selling 8 times as much stock as they are buying. The current level of insider buying is the lowest in 17 years. If this was the beginning of a new bull market one would think that corp. insiders would be buying stock hand over fist.

Lowry's also is not confirming this rally. Selling pressure spiked higher on Monday's 90% down volume day. Despite the continued rally into Friday, selling pressure is not backing off and buying pressure is not picking up.

I've noted on the third chart that we now have a weekly swing high in place on the S&P. This is one of the first signs to look for at an intermediate top. That being said I wouldn't be surprised if the market were to break through 875 early next week to soak up all the buy orders sitting at that level before rolling over.

We also have a potential 1-2-3 reversal in progress. A failed move to new highs on Monday would signal a 2b reversal. Something to watch for at Mondays close

Needless to say I think any break above 875 is going to be a false break. At the moment I'm leaning towards the counter trend rally out of the March lows either being over or very close to over at this point.

It looks like the market is being held up by the dollar declining into the daily cycle low. That low is due within the next 2 to 3 days. If the dollar continues to rally out of that bottom I think we will have the top for the stock market.

Almost all the short term indicators are again overbought. That also doesn't bode well for continued strength in the days ahead.

Shorts should probably continue to hold. As a matter of fact I think shorts would probably be advised to hold till we get the next weekly cycle low later this summer or or early fall. I don't expect this to roll over quickly to new lows by any means but we probably have seen or are very close to the final top of this rally price wise anyway.

gold


I may decide to stay a few more days so I'm going to put the weekly report on the blog this week. Granted this will be a condensed version as most subs already know what we are watching.

As I noted the other day gold completed the 1-2-3 reversal on Thursday. I've also included a weekly chart. Not only did gold bounce off the 75 week moving average, it also completed a weekly swing low. Actually gold completed a weekly swing low last week.

This was one of the things we've been waiting for as a signal that the weekly cycle had bottomed. I'm also leaning toward this signalling the B wave bottom. If this turns out to be the case then gold should now be entering the next C wave advance. I suspect this will ultimately turn out to be a massive rally. The size of the consolidation from March 08 has become extremely large. WD Gann noted that the size of the consolidation is often indicative of how large the ensuing rally will be.

I expect this one to be huge and probably last at least into the fall if not spring of next year.

This is the time to reread Old Turkey as I suspect quite a few investors are going to lose their position during this rally. Remember bull markets get overbought. Then they get more overbought. Oscillators are not going to be our friend during a C wave rally.

Subscribers know what to look for before taking profits on mining positions. At the moment neither of our two signs are anywhere near the "take profit" level and I doubt they will be for at least a couple of months and probably not for many months. Hopefully this rally can drag out long enough to put us into the long term capital gains bracket before we get the sell signal.

A quick word on the miners, which is where we want to be invested instead of actual gold and silver, as the miners are still hideously undervalued.

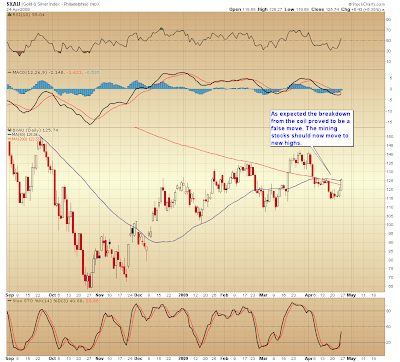
The move on Friday suggests that the breakdown from the coil was indeed a false move as expected. We should now see a much stronger and more lasting move in the opposite direction. I expect the miners will make new highs for the move in the coming weeks.

I don't have access to my spreadsheet at the moment but a quick glance at the current COT report suggests that the Blees rating on silver is in the low to mid 90's this week. I can tell you from past experience there's no way I want to be selling silver or anything related to silver when the Blees rating is that high.

There will be no changes to the portfolio this week and I kind of doubt there will be anytime soon.

Thursday, April 23, 2009

Just a quick post from the road.

So far it looks like the market is still working it's way down into the daily cycle low.

Gold's close above $900 today completes the 1-2-3 reversal that I mentioned in Mondays update.

I'm planning on returning Monday in time to get out a Monday update.

In the meantime I'm having fun hanging off the cliffs :-)

Monday, April 20, 2009

One more climbing trip


I'm going to be climbing in the Canyonlands this week. I'll be back Sunday or Monday. New subscriptions should wait till Monday as I won't have internet access till I get back.

Sunday, April 19, 2009

Bottom? Only if we've seen either the longest 4 year cycle low in history...


Or the shortest. For March to be the low and the end of the bear market it would also have to be a 4 year cycle low. I find that pretty unlikely and here's why.

The last confirmed 4 year cycle low occurred in Oct. 02. In January and March 08 all the signs that mark a four year cycle low occured. At that time the percentage of stocks on the NYSE above their 200 DMA dropped below 20%. Monthly MACD crossed over. We formed a quarterly swing high, etc.

If Jan./March 08 did in fact mark the four year cycle low like I think it did then it was the second longest four year cycle in history at 65 months. Only the 32 to 37 cycle stretched longer at 66 months.

For March 09 to be the bottom as as so many bulls are calling for, we would have to believe that either we've just seen the longest 4 year cycle low in history at 77 months (11 months longer than any other cycle) OR we would have to have seen the shortest four year cycle in history at only one year.

Both of those scenarios are so far out of the historical average that it seems pretty unlikely.

What seems more likely is that we did in fact get the last four year cycle low in Jan/ March of last year. The market then rallied into the May top for two months and is now working it's way down into the next four year cycle low due probably in the fall of 2010.

When the market rolled over in May and broke below the March lows last year it set up the most bearish left translated 4 year cycle in history.

I don't think this is over yet and unfortunately I think there is a lot more pain to come. Secular bear markets almost always end up going down much further than almost anyone can foresee. Just like bull markets go up much further than anyone can imagine.

I think the Dow has a lot further to fall and gold has a lot further to rise before this is over.

Friday, April 17, 2009

Bear Market Rallies


The scatter chart shows just how stretched this rally has become. At yesterday's high this was the third largest bear market rally in history. (I've excluded the 50% rally out of the 29 crash).

Many of the sentiment indicators are now at or above levels last seen at the May 08 and Jan 09 tops.

Breadth in just about every sector, especially tech, is stretched higher than it was at the 07 top.

Miners on the other hand are working off the bullish sentiment from the 100% gain out of the Nov. low. Breadth is now back to levels that have signalled bottoms in the past.

The XAU has broken down out of the coil. As I pointed out the other day the odds are now 70% that this will be a false break. The true move will most likely be in the opposite direction. This move should be much stronger and longer lasting than the initial break.

On top of that gold should be only a few days from a cycle low. The stock market on the other hand should be only a few days from a cycle top if it hasn't already made it.

Wednesday, April 15, 2009

4 day rule


Silver is now signaling a "4 day rule" possible trend change. Victor Sperandeo's 4 day rule states that after a long intermediate move 4 days in a row in a counter direction often signals a change in trend.

I'm going to go over B waves and mining stocks in tonight's report.

Monday, April 13, 2009

What can we expect


I suspect quite a few bears are waiting for the next crash. I'm afraid they are probably going to be disappointed.

The crash last Fall was a once in a lifetime event that's not likely to repeat during this bear market.

Usually bear markets will stair step down gradually. Subsequent legs down will normally break to new lows by only 10-15%. The final move into a low can occur rapidly and one can easily miss it. Or they can stay short to long and get caught as the market roars out of an intermediate low (I suspect this happened to quite a few bears in March)

On top of that it's not easy to spot the tops of these counter trend rallies. Every one of them will be accompanied by the masses calling for a new bull market. Just like they are doing right now.

By the way the weekly cycles are starting to line up I'm guessing we still have three more major legs down in this bear market.

In case I haven't pointed it out before it's pretty tough to make money in bear markets. One needs excellent timing and a good bit of luck.

Bull markets are much easier and infinitely more rewarding, profit wise (shorts can only gain 100%).

Now if there isn't a bull market anywhere I will try to scratch out a living shorting stocks. Fortunately there is a bull market.

In my opinion capital would be much better deployed in the gold bull than trying to short stocks.

Saturday, April 11, 2009

Why precious metals

Let me start with a couple of basic fundamental truths.

"Liquidity will eventually find it's way into undervalued assets." & "Starting in 2000 we entered a secular bear market for paper assets and a secular bull market for commodities."

These two big picture fundamentals have been the driving force behind my main investing themes for the last 5-6 years.

So starting in 2000 liquidity began the lengthy process of moving out of overvalued stocks and into undervalued hard assets. No where was this more evident than the energy and base metal sectors.

The explosive growth in emerging markets was a big driver behind the impressive gains in these two sectors.

Commodity bull markets unfold in two phases and the principle of liquidity moving to undervalued sectors will govern what sectors will lead the second phase.

By that I mean the commodities that underperformed during the first phase will be the leaders during the second phase as liquidty finds its way into the cheapest commodities.

The commodities that underperformed during the first phase were agriculture and precious metals. During the second phase we will see these sectors outperform energy and base metals.

That doesn't mean these two areas won't see gains. I suspect they will see big gains but they aren't going to be anything like what we are going to see in Ag and PM.

The fundamentals are now on the side of agriculture and precious metals. The global depression is going to put a damper on demand for energy and base metals. However food supplies are now at multi decade lows and every central bank in the world is printing money as fast as they can trying to stem the economic collapse.

These two fundamentals are going to be the main driver of the second phase of the commodity bull.

What it is and why it ain't going to work

Let's face it, this isn't a normal recession. As such the Fed isn't going to be able to cure it with an expansion of credit.

What we are experiencing is the bursting of the largest credit bubble the world has ever seen. This would be bad enough all by itself. These are the conditions that led to the Great Depression after all.

However the Fed, in their misguided and fruitless attempts to stop the deflation last year, printed enough money to spike oil prices which only exacerbated the problem.

The problem is there is too much debt in the world. We've reached a point where we can't service this debt anymore. Trying to force more debt onto the world to keep the party going just isn't a valid approach anymore. The world needs to purge debt not create more.

Of course with the latest rally we are hearing the calls that the worst is over and the Fed's reflation attempts are finally working. Then again we heard that in Sept and Oct of 07, in Dec. 07, May of 08, July of 08 and Jan. of 09. See a pattern emerging?

I would warn investors not to get sucked into this nonsense. This market will bottom when we get to cheap valuations and when the economy bottoms and not until.

Throwing free money at banks isn't going to stop or even slow the economic collapse. Only purging debt and a return to growth based on productivity and not debt expansion will do that.

This time the Fed won't be able to manufacture a bottom for stocks just by expanding credit and printing money. What they may do is spike energy prices again if they aren't careful and intensify the economic collapse.

Thursday, April 9, 2009

Miners coiling for a big move


Volatility has collapsed in the miners. This kind of volatility coil usually precedes a big move.

Contrary to what most investors believe the initial move out of a coil tends to be a "false" move about 70% of the time. After the initial break the larger and more sustained move is usually in the other direction.

Precious metal investors should be hoping for a break lower. That would give investors not only a better entry but put the odds in their favor that price will soon be moving up.

Of course one could always buy into a flashy bear market rally if they believe CNBC and think the bear is finished.

Personally I would rather buy an oversold correction in a bull market than an overbought bear market rally.

The negatives are starting to build against this market rally continuing much further. I'm going to go over those negatives in tonight's report.

Tuesday, April 7, 2009

Moe Ronn & John I. Que

Today I'm going to print an excerpt from last nights report. I think it's appropriate right now.

"At this point I think it’s probably time to talk about taxes. As far as I can remember I’ve never really discussed the topic of taxes but that doesn’t mean it’s not an important one. I think you will see by the time I’m finished that it is a very important one.

Let’s jump in by creating two fictional characters Moe Ronn and John I. Que. They both believe the Dow:gold ratio is heading down and want to invest in the precious metals bull market. However, they go about it in very different ways.

Moe wants to trade mining stocks over the next several years. He has a stake of $500,000. He jumps in and out of trades making up to 1000 trades per year. Sounds impossible doesn’t it? But I guarantee there are many traders that do that or even 5 times that amount in a year. Right off the bat you are throwing away, conservatively, $7,000 to $35,000 to your broker. (There’s nothing I hate more than making my broker rich)

Now let’s say Moe manages to turn a profit with all of this trading of say $50,000 (hey it is a bull market and hopefully even Moe can make money in raging bull market). Now lets say Moe has other income that put him in the 33% tax bracket. Moe’s $50,000 is going to turn into roughly $33,000. So Moe turned his $500,000 into $527,000 after taxes and broker fees the first year by trading like a banshee.

Now while Moe was frantically jumping in and out of the market John bought a basket of undervalued miners, stuck them in a separate account and forgot about them. John paid his broker conservatively $70- $100. At the end of the year John’s account is up 100% (impossible you say. Take a look at mining stocks and juniors for the last several months)

At the end of the year John doesn’t pay any taxes on his gains because he hasn’t taken them yet. So John turned $500,000 into $1,000,000 (minus the $70-$100 brokerage fees. John’s broker doesn’t like him very much, by the way).

The next year Moe continues his frantic trading regimen again managing to eke out a 10% gain. After taxes and broker fees his account has grown to roughly $555,000.

John is still holding but this time he’s up conservatively 200% (the gold bull is really kicking into high gear now) So his $1,000,000 is now $3,000,000. No broker fees this year.

Keep in mind that while Moe is sitting in front of his computer every day with a bottle of Pepto Bismol, John is out playing golf or rock climbing if he’s not quite as intelligent about his hobbies as he is about his investing.

So now let’s say we come to the third year of the bull market. All the signs are there that the top is close. The Dow:gold ratio is approaching 1:1. Everyone and their cousins are buying gold coins. Moe has had a banner year and is up 30% (we are going to assume that Moe can spot the top and get out before losing all his profits) Roughly speaking Moe came away from the greastest bull market of our time with $660,000 after taxes and fees.

John on the other hand also had a banner year, his account was up another 200%. He now has $9,000,000. He incurs another $70-$100 in brokerage fees to sell his positions and a 15% tax on his capital gains which leaves him with $7,725,000.

Now let’s assume that Moe could some how match John’s buy and hold strategy by trading (he really can’t but I just want to make a point). The first year after taxes and broker fees Moe is left with $810,000. The second year after taxes and broker fees Moe’s portfolio has grown to $1,880,000. Finally after another banner year Moe is rewarded for all his time spent in front of his computer with a grand total of $4,340,000.

I’ve rounded the numbers and calculated taxes solely off the highest tax bracket so the actually numbers will be slightly higher but you get the picture. Trading as opposed to investing in this bull market is going to drastically reduce what one is going to make out of what will probably be the greatest opportunity any of us will ever see in our lifetime.

The loophole is there for anyone who wants to keep most of their profits. Or you can give away a big chunk of your earnings to the government. The same government, by the way, that destroyed our economy and will probably end up destroying our currency.

I got to say I’m leaning more towards letting the government fend for itself and keeping as much as possible."

Sunday, April 5, 2009

Platinum still acting strong


It seems like everywhere I look I see predictions for gold to head back down to $600-$700.

Now I'll be the first one to admit that anything is possible but I must say all this negativity just tickles me pink. This is exactly what we need to see for gold to continue higher.

The first chart is the 50 and 200 EMA for gold. What do you think, is this chart going up or down?

Take note that just like the first phase of the gold bull the 50 is again back above the 200.

Next we have a chart of Platinum. It led the precious metals bull during the first phase and it has now rallied back above the Feb. highs. If Platinum is leading again, then I would expect the rest of the metals complex to follow shortly.

Gold is still in the process of putting in the B wave correction. I'm expecting that to bottom with the soon to be due weekly cycle low.

The junior sector is now coming alive with many juniors exhibiting breakout rally days on huge volume similar to many of the energy stocks in 02 & 03.

Gold has broken out above the 1980 highs of $850. That is a 28 year consolidation by the way. WD Gann pointed out that often the size of the consolidation will determine the magnitude of the rally once an asset or commodity breaks out of that consolidation.

Look at what happened to oil once it finally broke thru the $40 ceiling.

So like I said, anything can happen, but at the moment I don't see anything to suggest that the current pullback isn't just a normal B wave correction in an ongoing monster bull market.

Saturday, April 4, 2009

Tick, tick, ticking away

The 200 DMA of the daily cumulative tick is again at overbought levels that during this bear market have led to at least short term declines.

I went over several intermediate term implications in this weekends report also. The bottom line is we need to see some kind of corrective move soon if this rally is going to continue.

Thursday, April 2, 2009

Beware the technicals


I continue to see investors try to trade precious metals based purely on technicals. I still believe this just isn't possible as these markets are too thin, especially silver.

I think gold is now entering the final stages of the B wave decline. This is the period when the gold bull is going to try to shake off all the weak riders before the next leg up.

Take a look at the first chart of silver. Technically it looks like a complete breakdown. The technicals would obviously keep any sane investor from buying here right? This thing was obviously going much much lower.

However, anyone watching the COT reports at that time would have noticed that the commercial traders were the most bullish they had been in four years. Smart money knows you can't trade silver off of technicals. Smart money buys value.

At that time, the smart money was snapping up silver as fast as the retail crowd wanted to unload it to them.

Now look at the second chart. Who came out the winner here the technical traders or the value investors?

In my last post I pointed out just how cheap mining stocks are right now. Well silver is every bit as cheap if not cheaper than mining stocks. (what does that say about silver miners?)

I think silver is poised for an explosive move higher once gold's B wave ends and the C wave starts.

However don't get fooled by technicals. I wouldn't put it past silver to do something drastic to get all the the weak hands to cough up their shares to the smart money just like it did in 07.

Margin of safety

Historically a Gold:XAU ratio of 5 or higher has been a sign that mining stocks are too cheap.

I often field questions from investors worried that the B wave decline isn't over yet. My response is "so what". Gold could drop to $800 and the mining stocks would still be too cheap. As a matter of fact the XAU would have to rise to $160 just to get back to historically cheap valuations if gold were to drop to $800.

The bottom line is that investors now have a huge margin of safety in mining stocks even if gold's B wave has further to go. They should continue higher even if gold drops a bit more.

In case no one has noticed that is exactly what they have been doing for the last month.

Wednesday, April 1, 2009

Bull market anyone?


Gold is the only asset that is still in a bull market. Notice the 50 day moving average is rising and has crossed back above a rising 200 DMA.

The 50 DMA is rising and has now crossed back above the 200 on silver also. It will still require a bit more work but I expect the 200 DMA to turn back up on silver to.

Both the XAU and HUI 50 DMA are rising sharply and on the verge of crossing back above the 200 DMA.

An investor can either fight with the bear and scratch out a living trying to short stocks or they can get on board the only bull market left.

I expect it to be one of the most powerful bull markets that any of us will ever see by the way.