Thursday, May 31, 2007

Trendline break buy signal


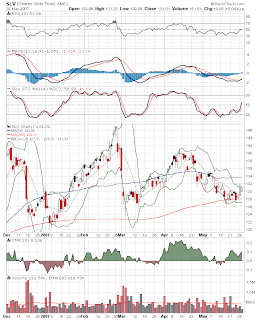
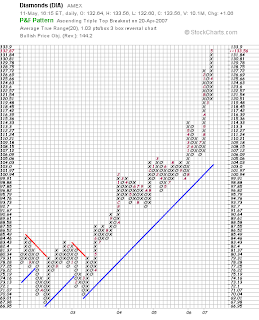
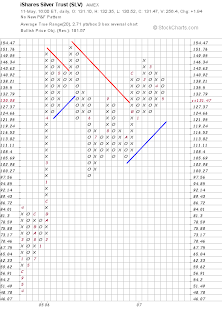
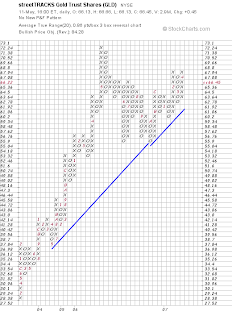
Just as you can use a break in the trendline as a sell signal you can also use it as a buy signal. In the first chart you can see where silver broke the trendline. Coupled with this weeks very bullish COT report for silver. This looks like a pretty good setup to buy or add to (if you're already a precious metals investor) your silver position. In the second chart you can see the same signal for the PM miners. One thing to take notice of is the large % move in the HUI. Normally the mining stocks will lead a move up in the metals and thats exactly what's happening today. I've also pointed out a great example of a 2b reversal on the HUI chart.

When to sell?


Knowing when to sell is probably the most difficult thing to learn in investing. The rule is let your profits run. So how do we know when the run is over?
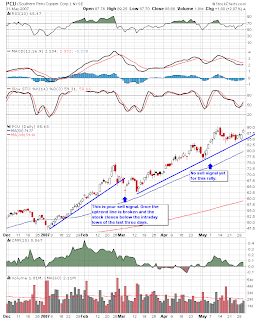
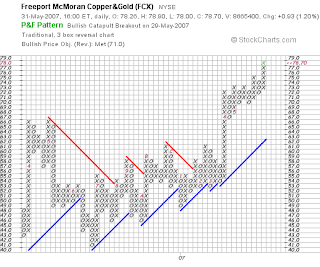
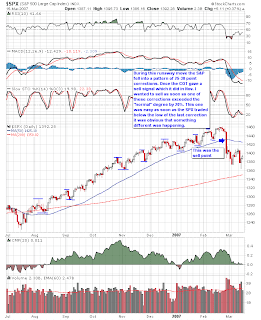
The first chart demonstrates a sell signal generated by a trend line break. The next chart is a point and figure chart of FCX the bullish price objective was met at $71. That is your sell signal. The third chart demonstrates the sell signal in Feb. accompanied by a COT sell signal. My experience has been that there just isn't anything that compares over the long haul to following the COT buy and sell signals. But here are a couple of options. As you may have noticed the VTO and bollinger band systems that I have described in the past all had very well defined sell rules. Before you enter into a trade know what your sell signal will be along with your stop loss level.

Silver


Silver has held the 200 day moving average and the COT report is getting very bullish. When this one starts to move it can rally violently because silver is a thin market. If you are investing in precious metals you want to be "in" before the move happens or you risk missing it. As I write silver is up .23 in the premarket which would translate into roughly $2.30 on the SLV ETF.

People are simply not wired to make smart financial decisions

The distinguished Robert Shiller wrote an article in Forbes recently about how ordinary people can easily hedge their risk against higher prices on things they consume. For example, don’t complain about high gas prices. Do something about it — like buy some oil. It makes perfect sense. However, as Roger Ehrenberg points out it doesn’t work in the real world. Why? Because when it comes to personal finance people will consistently do stupid things. Like individuals buying single stocks because they are so smart and the market is so dumb. Like gamblers making larger bets as they are losing as opposed to shrinking bet size as their assets drop. And these are just two examples of what extensive academic literature has shown is, unfortunately, human behavior. When it comes to economic decisions, we frequently do absolutely stupid things. We just do. And we can't help it. So when Mr. Shiller proposes what is, in effect, an elegantly straight-forward risk management strategy for laypeople I shudder.

I must admit that I have fallen into this group myself many times. Once I started letting the smart money make my financial decisions for me life got much better.

Wednesday, May 30, 2007

Another "typical" correction

As of today's close it looks like the market has completed another "typical" correction. The COT is extremely bullish. There's nothing to do but enjoy the ride until the big boys tell us it's time to sell.

Markets topping?


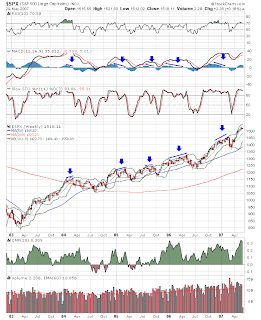
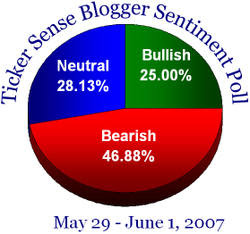
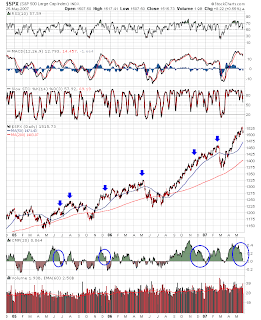
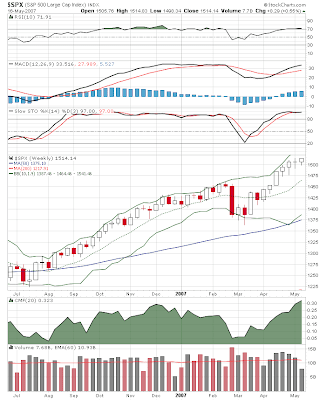
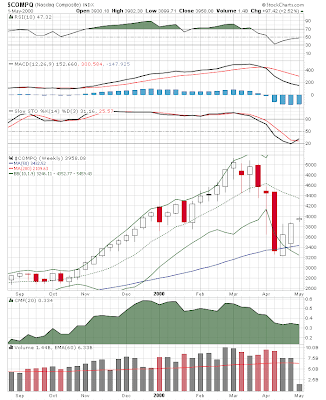
When the market throws a curve ball at you like it appears to be going to do this morning it helps if you take a step back and look at the big picture. Notice on the weekly charts that there has been no intermediate top without some serious divergences in momentum. Thats not happening yet. That's not to say that it couldn't be diferent this time but you have to trade with the odds. The odds are saying we will probably be getting a buying opportunity here. Also intermediate tops are accompanied by bullish sentiment readings, granted ticker sense is only one method but this seems hardly bullish by any stretch of the imagination. Then there is the biggie, the commercials are buying like it's 1999.

Tuesday, May 29, 2007

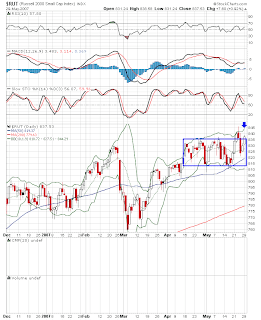
Russell


As you can see by the above chart the Russell has already broken out of the consolidation area as of today. It would seem to be a positive sign for the market that the speculative small caps are leading again.

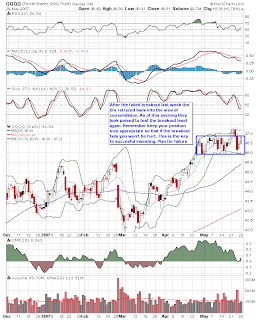
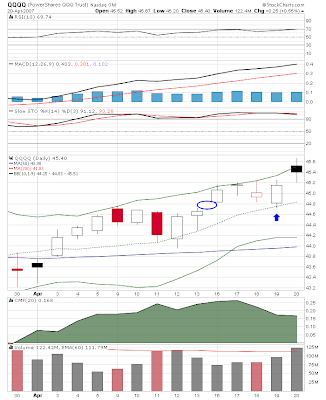
Q's poised to attempt another breakout

After the failed breakout attempt last week the Q's look poised to attempt another breakout.

Money flows


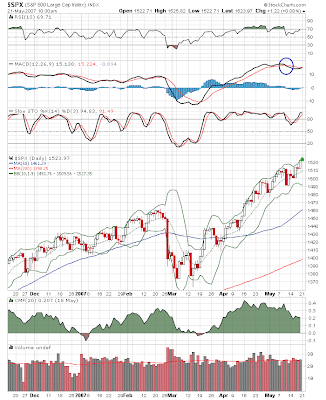
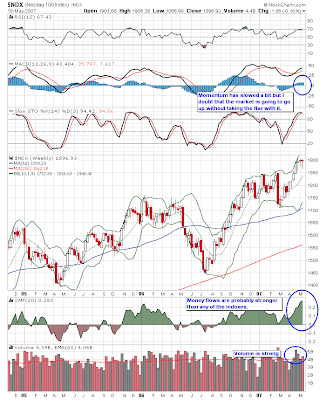
Quite a few people have pointed out that the money flows are drying up on the daily charts. True but look at what has happened in the past when money flows have tailed off. Quite often the market just needed a breather before powering up to fresh new highs. Another example of why I pay more attention to the weekly charts. There are no such divergences on the weekly charts yet by the way.

Monday, May 28, 2007

New subscribers

New subscribers bear with me, after you send in your subscriber "request" I have to send out a paypal bill before I put you on the subscriber list. I don't have the system automated and I'm hoping not to have to resort to that as I still want to remain "retired" What started out as just an interesting way to elaborated on some of the ideas I post on various blogs has snowballed in just a couple of weeks. So if it takes me a day to respond to your request you'll know it's because I'm out hanging off a cliff somewhere :)

Friday, May 25, 2007

COT report for May 25

COT still long. However I was quite astounded by what happened this week. I'll have a detailed report and market summary out Monday evening as I'm going on a, what else, climbing trip this weekend. Until then have a great weekend and drive safe.

Daily update feedback

I would like to get some feedback if subscribers want me to keep sending the daily updates. Most of the info I send is probably old news to the experienced traders. But if enough people find it useful I will continue to e-mail comments if I find anything that I think might be important or interesting.

Thursday, May 24, 2007

Point & Figure Charts


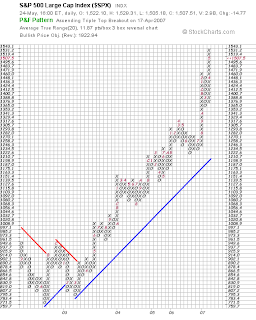
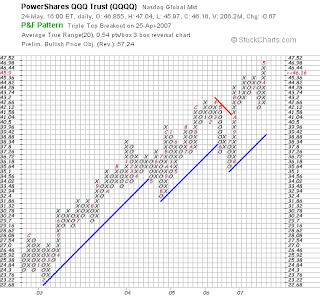
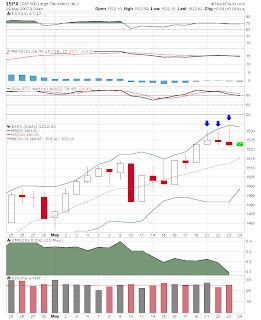
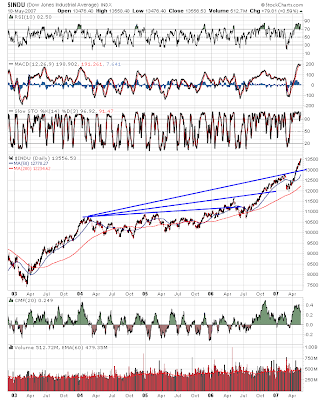
Let's take a look at the point and figure charts. The sell off the last two days so far hasn't even been enough to trigger a 3 box reversal. So far the price action this week is just noise. Side note: the bullish price objectives have moved up a bit, the Q's are currently showing a price objective of $57.24 and the S&P is now at $1922. Keep in mind that this doesn't mean that the indexes will trade up that much. However in strong bull moves they quite often do hit their price objectives. The bullish price objective on the Dow was 12,548. As we know the Dow blew thru that and is now 1000 points higher.

Parabolic moves

After going over historical statistics it has become apparent to me that parabolic moves tend to produce large % gains. When the Nikkei went parabolic in 89 it produced a 44% gain. The last parabolic leg in 1966 over 100%. The last leg up in the 20's over 100%. The NASDAQ in 99 81%. The gold bull in 1980 over 100%. The gold leg last year 32%. The recent parabolic move in China 60% so far. Of course it is certainly debatable as to whether the US markets have entered a parabolic stage. However the angle of assent has increased radically. The markets are trading up about 70% of the time. Pullbacks have been very slight and usually only last a couple of days. The markers are certainly there. If this market is going to continue into a full fledged parabolic move then history would suggest that we should expect a rather large move.

Three the magic number?

The Dow took three tries to break thru the old high also. Will the next attempt at the old highs on the S&P hold? My guess is yes.

Wednesday, May 23, 2007

The China Bubble

We have all been hearing lately how the Chinese stock market is in a bubble and ready to collapse any day. Seems everyone is in agreement right? However when you actually think about this a bit a few things don't add up. First off when have we ever had a bubble where everyone knew it was a bubble? In 99 & 00 the vast majority of investors were convinced that we had entered a new paradigm. All that mattered was how many eyeballs saw your website, the money would come, the world had entered a permanently high level of economic bliss, etc. etc. Now lets progress to the real estate bubble. At the top in the summer of 05 we were hearing all kinds of excuses for why the real estate boom was not a bubble, from a scarcity of land (Cramer) to the good old cliche "well real estate never goes down" blah, blah, blah. What I'm trying to get across is that bubbles are characterized by mass denial and ludicrous reasoning for why the bubble is in fact not a bubble. That's not happening yet with China. Everyone seems to agree that it is a bubble. Now lets go back to 99-2000. About half the population was buying tech stocks. The public was in, big time. Same thing for real estate. Everybody buying, multiple houses. ARMS, option ARMS, what ever it took just buy. So recently we've been hearing stories of China opening 300,000 brokerage accounts a day. 2.7 million more accounts opened in 06 than 05. Whew the public is in big time right? Lets say even if China opened 300,000 for every day of this year and we add on the 2.7 million from last year and lets give them 10 million already existing. That means the public in China has roughly 55 million active retail brokerage accounts. Wait a minute the population of China is 1.3 billion, that's billion with a B. That means a whopping 4.2% of the population is now into the stock market. It's definitely heading in the right direction but still a far cry from the 50% that has characterized most of the bubbles throughout history. There just may be a ways to go yet if a really significant portion of the population enters into the fray.

One reversal day does not a bear make!


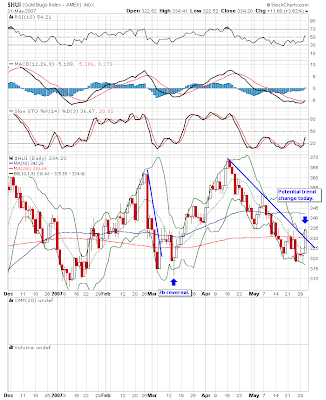
Its happening again. As soon as we get a small pullback in the market everyone who said "I'll be going long as soon as we get a pullback" immediately throws their "plan" out the window and declares the bull run is over. Remember the commercial players don't trade on emotions like all the bears apparently do. The COT says that the big boys are looking to buy your shares. What better way to do it than to get a sharp little pullback to scare out all the weak hands and have them give up their shares at a cheaper price. If you can't control your emotions and stick to your "plan" it's going to be very hard to make money in the markets. Lets just summerize what happened today. The Dow is down 3 days in a row. Hasn't happened very often in this rally. The down days are very slight and on low volume. What happened the last time this senario played out? The Dow proceeded to gain 400 points. The Nas has had one down day after 3 up days. Works out to 75% up days. What have I been saying, the market is trading up 68% of the time. I think the market just decided to take a little profit this afternoon. Where is the catalyst for this market to fall? Does anyone seriously think that just because Greenspan, who's predictions are notoriously badly timed, says the Chinese market could fall that that is the catalyst to turn this market around. Now interest rates are rising, that might be a catalyst but if it is then the big boys don't seem too worried about it. If they aren't worried then I'm not worried.

Tuesday, May 22, 2007

Patience, a golden quality


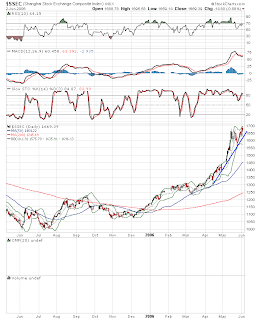
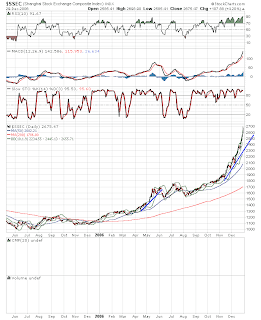
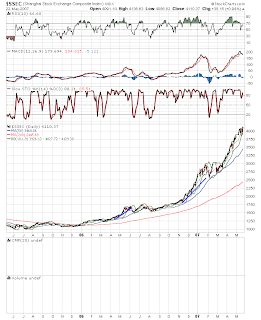
Someone once said that if you can't envision an asset gaining many multiples in value then you will be unlikely to invest in it. I'll add that if you can't envision your trades gaining substantially in value you will be likely to sell too soon. In the first chart we see the Shanghai index bottoming in July of 05. The Chinese stock market had just lost over 50% of it's value. Sentiment at this time would be black pessimism. So when the market started to rally I'm sure there was plenty of scepticism. How many people do you think had the patience to hold on for a 25% gain? How about a 50% gain. The market was already trading parabolic at this time. I suspect quite a few were taking profits and calling the top or at least a serious correction. Well in the second chart we can see that after a short pullback the market shot straight up to over 2000 in 7 months. That's over 100% gain in a year and a half. This market is getting ridiculous you say it can't keep going. Now it's REALLY trading parabolic. SELL, SELL, SELL. On to chart three. But wait after a sideways consolidation the Chinese market doubled again. Remember good ole technical rule #1? This is why I use the COT report. Here in the US we have a tool that gives us some kind of legitimate sell signal. If the big boys are selling then they are removing the liquidity that the market needs to keep going up. As long as I follow the smart money I won't get impatient and miss a potential run like this.

Monday, May 21, 2007

Still too many bears


Seems like no matter how much this market goes up it just can't convince investors it's for real. It has certainly convinced the smart money. They just keep increasing their long position.

Follow up on Is the market rolling over

I want to point out the hazards again of just using T/A to predict the future. Just last week when the market had the small correction quite a few guru's were pointing out that the market was rolling over. Well now its a week later and the S&P is 30 points higher. T/A can tell you with 20/20 vision what has happened but seeing into the future is still just as difficult as ever without a crystal ball. Does anyone have a working one of those by the way :)

Gap trade


Here is another short term trade that may signal this morning. When the Q's gap up on Monday morning 99% of the time they fill the gap within the week. If I remember correctly the one time they didn't fill during the week they did fill the gap the next week. At the moment the Q's are trading about .08 above the Friday high. If you are going to play this one with options you will need to let the market settle down before buying puts as the volatility will cause the spread to be too large right at the open. Since there is normally a .03 spread on Q options you might want to let this run and see if the Q's can trade up .15-.20 before buying puts. Keep in mind that this is a very strong market so keep position sizes small in case this just happens to be that 1%.

Sunday, May 20, 2007

To trade or not to trade a bull part 2

I'm going to revisit this idea because I think it's important right now. Should you try to trade in and out of this bull market? My thoughts are no you shouldn't and here's why. This is one of the longest bull markets in history. There have only been 3 longer. We haven't had one single correction of 10% or more during this entire bull. Fear has been reduced to a minimun. AKA investors are ready to buy any dip. Private equity is taking millions and millions of shares off the market not to mention companies are buying back shares heavily. Now I see where China is going to let banks invest abroad aka even more demand while supply is shrinking. Oh and if the retail investor were to come back in watch out. We are setting the stage for a parabolic run. To my eyes we are already in a parabolic run. When a market goes parabolic it just doesn't give you a chance to get in. So the last thing you want to do is lose your position by trying to get cute. Lately I've watched as we had 2 small corrections and the sentiment went from "I'm going to go long as soon as we get a correction" to "this is the top time to short" in the blink of an eye. This is how bull markets work they have sharp corrections that scare the weak hands out. That is why I watch the COT report. The commercials are not weak hands, they don't get scared out. What they do is buy your shares when you let your emotions take over. Trading takes disipline. Trading emotionally during this run will more than likely just guarantee that you give your money to the big boys. This is a time for logic. The market is strong right now. Make a plan and stick to it. My plan is to hold my long positions until the COT tells me to sell. Period

Trading suggestions

A few of the "subscribers" have requested that I post some of my "trades" I'm sorry to say my method of investing is going to be very boring to most. Here are my 2 trades. I buy and hold silver and gold. The actual metals. When I get a COT long signal I normally buy the Q's or the SPY and hold till I get a COT sell signal. When I get a sell signal I short the Q's until I get a buy signal. Pretty boring, but then again I'm not really looking for excitement I just want to make money. Actually I want to spend as little time thinking about investing as possible. (I should have thought of that when I started this blog). I do enjoy helping others learn investing though so I don't mind that much. You could also substitute the the Diamonds for the Q's or spiders. Every once in a while I will take a trade in an individual stock. When I do, I use deep in the money options with a delta of 85 or greater. SLW is just such a trade. If an investor wants to trade individual stocks my suggestion would be to go long commodity plays as long as the COT is in long mode and exit when the COT gives a sell signal. In case anybody hadn't noticed we are in a long term commodity bull market. Joel Greenblat has a great site for finding undervalued stocks. Coincidentally most are commodity plays. here is his site for any who are interested.

Saturday, May 19, 2007

Trendlines?

I'm going to show you the problem with drawing lines on a chart. I've often seen these trendlines used as a reason why the rally is or has topped out. As if somehow the stock market, which is just humans buying and selling stocks, are supposed to know that a line on a chart is bumping up against another line drawn on a chart and therefore they should quit buying. Trendlines get broken during bull markets. Another reason I follow the COT report. I'll look for this rally to be done when the big boys start selling not when a line on a chart touches another line.
Friday, May 18, 2007

weekly market summary


Well with all the negative hype in the media this week the market did just what many expected, it was up strong. I suspect this will continue. Believe me CNBC knows that the longer they can keep the public out of this market the longer this rally will last. I had to laugh when I saw that Eric Bolling on Fast Money was short Nasdaq and S&P futures. I'm going to take a guess and say he owns 1 of each just so they can post it in the full disclosure. This is one smart trader and he knows you let profits run. I really don't think Eric Bolling will be trying to play the amatuer's game of picking a top. On to the markets. All the indexes are looking very strong. I don't see any divergences in momentum or money flows yet. Of course if you've been following the blog you know that the direction of the big money via the COT report trumps everything else (at least for me) They're still long BTW. Another important consideration is that the Transports are also participating, a Dow Theory plus. All in all I just don't see any cracks in this bull yet.

COT report for May 18

The S&P futures are still long.
For any who would like updated spreadsheets and in depth analysis e-mailed every week just use the link under my profile to send me a request. The donation is optional if you feel my efforts help you in your investing and it's worth it then I'm glad I've been able to help. If your a college student on a budget then it's my donation to your education :)

GLD


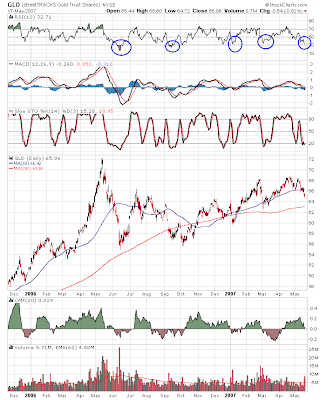
Gold is getting oversold. As you can see from the chart over the last year this has been a pretty good level to buy at. Very bullish that it is getting oversold and still holding above the 200 DMA

Whats more important? Making money or being right.

Mark Hulbert is right on target with this article. I can tell you from experience that most people would rather for you to be wrong telling them what they want to hear rather than be right telling them what they don’t want to hear. And don’t dare change your mind about a market opinion or strategy. That makes people uncomfortable. And people would rather be comfortable than make money. Again I would urge investors to turn off the TV and quit trying to find bearish blogs to confirm their opinion. Just trade what's right in front of you. This is the strongest bull market since 99.

Thursday, May 17, 2007

The cause of recession

Ever wondered why the real estate bubble popping hasn't caused a recession yet? The media and quite a few bloggers can sure make it sound like it should. The thing is that sub prime mortgages although certainly a problem for some don't affect that much of the population. Oil now is a whole n'other story altogether. The popular belief is that the Fed tightened in 2000 and burst the bubble and sent the economy into a mild recession. Certainly a factor. However one small fact that no one seems to notice is that during that time oil almost tripled in a year. Energy is required by everyone, it's the life blood of an economy. When the price spikes rapidly it sends a shock wave through the economy usually leading to a recession down the road. As long as it rises gradually all is well. Kind of like putting a frog in a pan of warm water. As long as you turn up the heat slowly he will sit right there and boil to death. However if you throw him in the boiling water right off the bat he'll jump right back out. I've said this before, the problem with printing money is it causes inflation. Unless the Fed can figure out a way to keep all that money out of the commodity markets especially oil we're going to have a problem on our hands down the road. We had severe inflation problems and several recessions in the 70's and 80's along with several oil shocks. We we're fighting the Vietnam war and trying to pay for it by printing money. See a pattern here. So keep an eye on oil if we see a spike to $90-$100 this year then bad things could be just around the corner.

Wednesday, May 16, 2007

Irrational Bull Market?


There seems to be a preoccupation with how many days the market has been up vs. how many days down and somehow this is irrational hense the big correction is right around the corner. Compare the chart of the Nasdaq in 1999 & 2000. 19 up weeks to 2 down weeks. The Naz gained roughly 80% in 4 1/2 months. Most of the companies in the index weren't even profitable. That is irrational. Now compare the S&P which is up about 23% in 10 months. Dominated by financials and energy stocks that are making money hand over fist, I'm not sure how the word irrational can be used to describe this market.

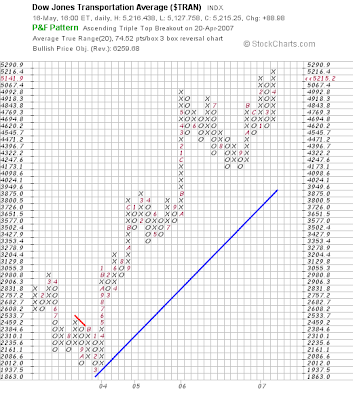
Trannies Point and Figure chart

Trannies also in a powerful bull market. Might I suggest that you turn off the TV and quit searching for bearish media articles and instead just trade what's right in front of you. There will be plenty of time to be bearish, just not now.

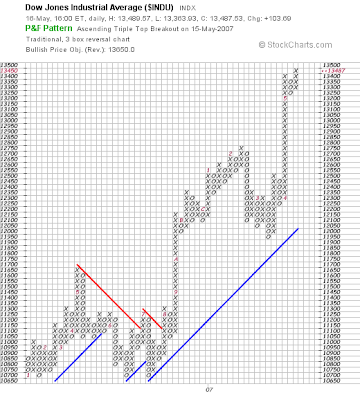
Dow Point and Figure chart

After making a long tail up the Dow consolidated back to the 13250 box and since has broken out to the 13450 box and looks poised to put another x in the a 13500 box possibly tomorrow. This is an incredibly powerful bull, fight it at your peril.

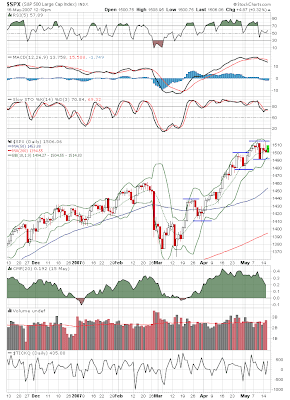
Runaway move continues?

Unless the S&P breaks down from here it appears that the runaway move is continuing with another "typical" 25-30 point correction.

Gold


The precious metals bull seems determined to wear out as many investors as possible. Those who could hold on thru the last similar period were rewarded by watching gold rocket from $450 to $725. Nobody ever said riding the bull was easy.

Tuesday, May 15, 2007

COT sell signals

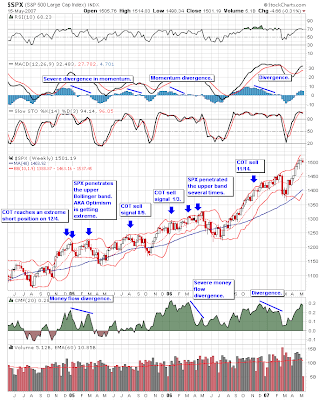
I've added the COT sell signals to the chart so you can see how the commercials usually lead any correction by at least several weeks. As you can see on the weekly chart all the corrections have been associated with money flow and momentum divergences, usually both. Also excess optimism as evidenced by penetrating the upper Bollinger band and overbought RSI levels. Until I get a sell signal from the big boys I've got to view any pullback as a buying opportunity. We are in such a strong bull leg and coupled with an extremely strong COT long signal that shorting before a COT sell signal seems very dangerous to me.

Q Bollinger Band crash trade

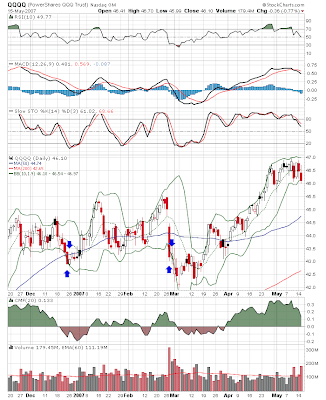
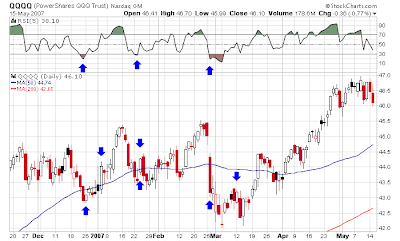
There seems to be some interest in short term trades so I'll post another one. This one is similar to the VTO trade and can also be used for quick front month options plays. The rules: Any time the Q's close below the lower Bollinger band (10day, 1.9 standard deviations) buy on the open the next day. Close the trade on any daily close that's profitable or after 15 days which ever comes first. This trade is also profitable about 98% of the time. Also could be a good entry for long COT positions. Just about any weakness tomorrow should activate this trade. Just another sign that the Q's are starting to get very oversold on a short term basis.

VTO Trade

The rules for the VTO trade are very simple whenever the Q's close with the 5 day RSI below 30 buy long and hold till the RSI closes above 50. This trade could be used with front month options as they are now priced in penny increments. You can either buy at the close or on the open the next day. I doubt that in the long run it will make much difference. If we do get a close below 30 in the next day or so I will be using the signal to add a bit of leverage to my long position. I will close when the COT tells me to sell.

Monday, May 14, 2007

Keep it Simple


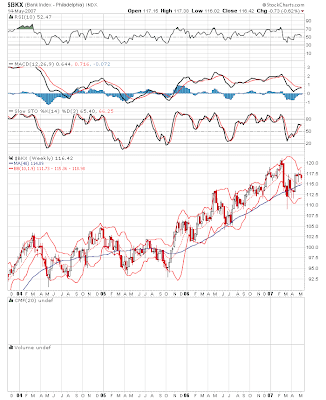
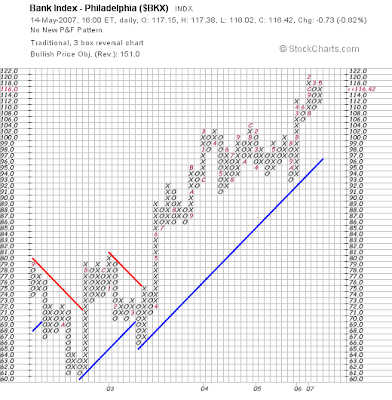
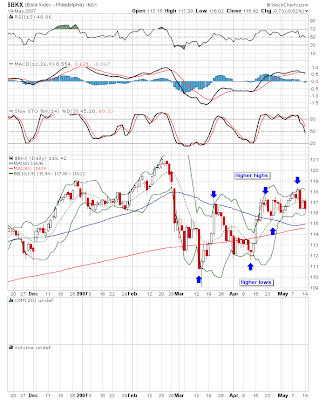
Here is a very simple way to determine whether I want to be long or short an index or stock. First thing I do is look at the Point and Figure chart. I want to make sure its in a strong uptrend . Secondly I want to know what the price objective is. Normally I would use a close say 2 boxes below the uptrend support as a stop loss. As long as the price objective is at least 3 times as large as my risk then I would consider the odds in my favor to take the trade. Of course there may also be logical stop loss areas other than the uptrend line on the point and figure chart. For the BKX I would say any close below the Mar 13 low would probably be a logical stop. Next I bring up a weekly chart. Now if I can stand on the other side of the room and tell that the 3-4 year trend is up and the asset is above the 40 week moving average so far so good. Last and least important I will look at the daily chart to see if the stock or index is still making higher highs and higher lows. You can play reversals but you will have to withstand larger drawdowns. I just prefer to have the momentum already heading up myself. Pretty simple. Of course all of this is dependant on having a current COT long signal.
Anatomy of a commercial long signal

3/20/07 4783/ .90 %
3/13/07 32718/ 1.16 %
3/6/07 36648 /3.96 %
2/27/07 45724/ 8.03 %
2/20/07 44756 /9.04 %
2/13/07 47003/ 9.94 %
2/5/07 52667 /10.03 %

I've extracted the pertinent data from the COT report from 2/5 to 3/20 during which time the commercials flipped to a long position. As you can see on Mar. 6 the combined net of both the large and e-mini contract showed a huge drop from 8.03% to 3.96%. This was signaling that something big was happening. 2 weeks later on Mar. 20 the large contract confirmed this move by dropping from -32718 to -4783, a huge one week move.


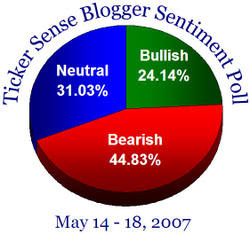
Too much negative sentiment

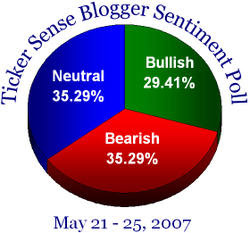
There's still way to much negative sentiment. The time to get worried is when the bullish side of this pie chart is at 45-50%.
China


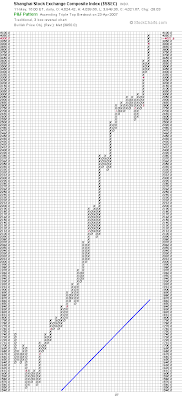
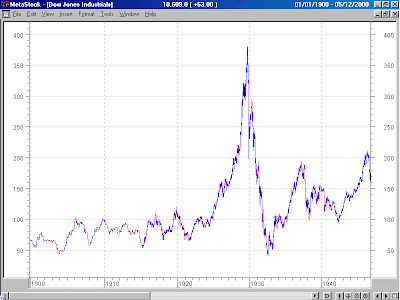
The Shanghai market has reached its price objective on the point and figure charts. So a couple of outcomes are possible. It could crash. This seems to be the popular opinion. However it could also trade sideways for an extended time. This is a scenario that no one seems to be considering. As you can see in the second chart after the devastating bear market ended in 1932 the Dow took off for a 300% gain. So the Chinese markets rise isn’t all that atypical following a severe bear market. Granted the Chinese market didn’t lose 89% of its value like the Dow did in the 1929 crash but it did lose 55%. That’s a pretty severe bear market by any measure. At the time the US was poised to start its run to become the economic superpower of the world. I think China is sitting in the same position as the US was coming out of the great depression. Will they have setbacks? Of course they will but I think in the long term China is just beginning.

Sunday, May 13, 2007

To trade or not to trade a bull

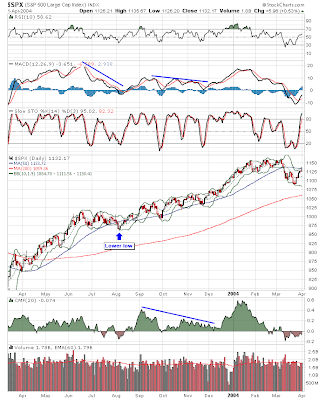
I'd like to show an example of why I don't try to trade in and out of a bull rally. What we're looking at here is the intial upleg out of the Mar. 03 bottom. The start of this bull market. Now if I was just using technical analysis I would have gotten knocked out of this bull run prematurely. Notice there were many divergences during this rise and one time when the market appeared to be ready to roll over and start making lower lows. If an investor only used TA he would have missed a good part of the nearly 30% run. Sure some can day trade in and out and lock in some profits. However I'm after bigger fish than that. As I've mentioned before the average upleg for final legs up in bull markets is 34%. So until the COT tells me to get out or the Point and Figure price targets are hit then I won't be doing something dumb like loosing my position. In strong bull moves the market can quickly get away from you if you're not in. I've mentioned this about PM before also. The PM are a lot more volatile than the S&P so it's even more important to establish a position in the metals and then just hold on.

Saturday, May 12, 2007

Runaway Moves

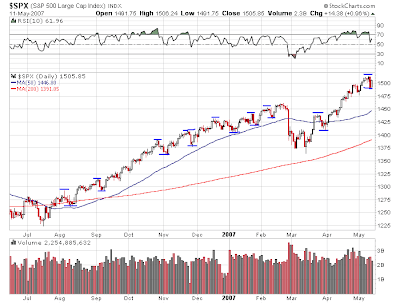
During a runaway move like we experienced from July of last year till Feb 27, notice that all the minor corrections were roughly the same size, about 30 points. We appear to be continuing that move. Again so far the minor corrections are uniform in size about 25-30 points. We want to watch for a correction that exceeds this size by say 20%. Once that happens the odds are good that the trend has changed. However notice how the angle of assent has steepened. We are now starting what looks like a parabolic run north. This is the kind of market action that will bring in the public. I think Feb. 27th was the last serious correction for this bull market. At this time as long as this runaway move continues I have a feeling it won't be long till the public starts to pile in. At the moment I'm hearing and reading quite a bit of negative commentary about how the market needs to take a break. This is not what you hear at market tops. As long as I'm hearing this kind of talk on CNBC I'll know the rally is still intact. Soon though I suspect we will start to hear more and more reasons why this time is different and because of such and such reasons this market is only just getting started. This will be pure BS. This is human nature at market tops. Greed and hope take control and we invent reasons for and why our good luck will continue indefinitely. Does anyone remember all the crazy excuses for why the real estate market was not a bubble and why we had reached a permanently high level that would perhaps level off or slow down but would never in a million years go down. Well if I'm not mistaken real estate is going down. Like I said pure BS. So lets make some money on the way up but lets not lose sight of what is really happening here. Human emotions are starting to over ride common sense.

Are the Q's rolling over?


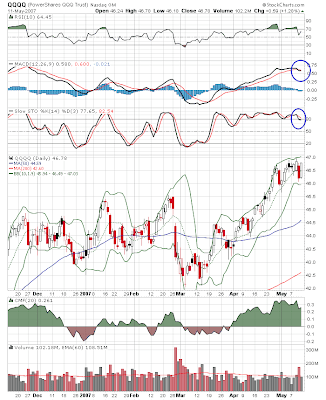
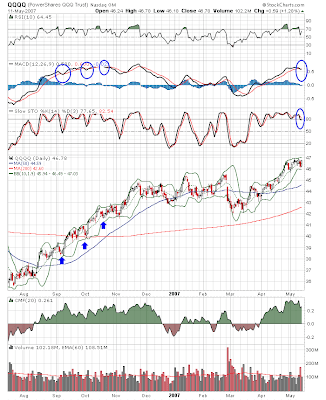
Quite a few people have mentioned that the Q's are rolling over. On the short term chart that does appear to be true. However after looking at the second chart you can see the hazard of projecting into the future what you want to happen.

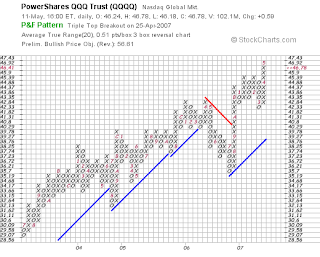
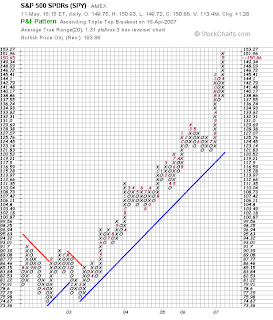
Point & Figure Charts


I like to watch the Point and figure charts as they elimanate the daily noise and the support and resistance levels are clearly defined. During strong bull markets the price objectives are often met.