
 Knowing when to sell is probably the most difficult thing to learn in investing. The rule is let your profits run. So how do we know when the run is over?
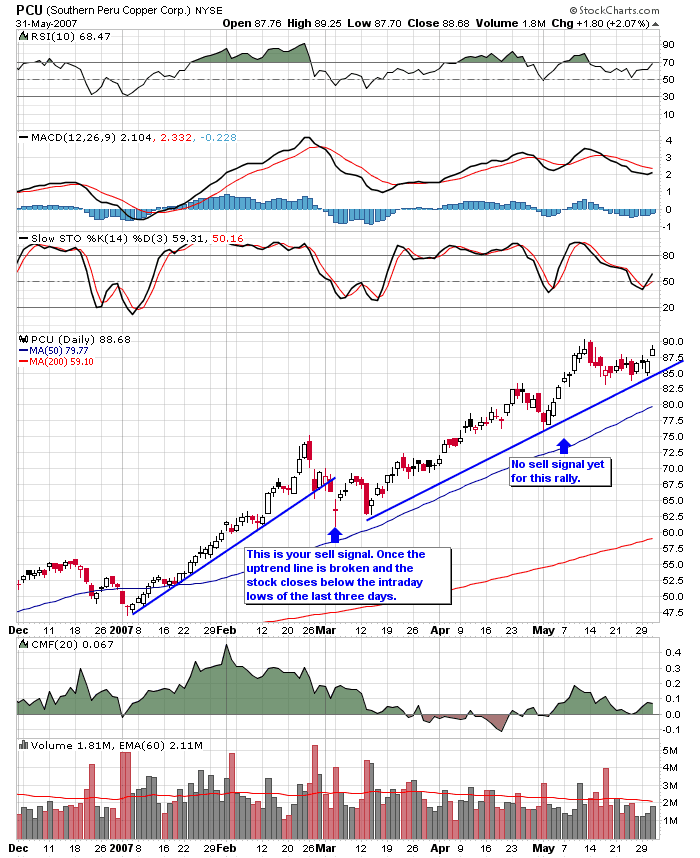
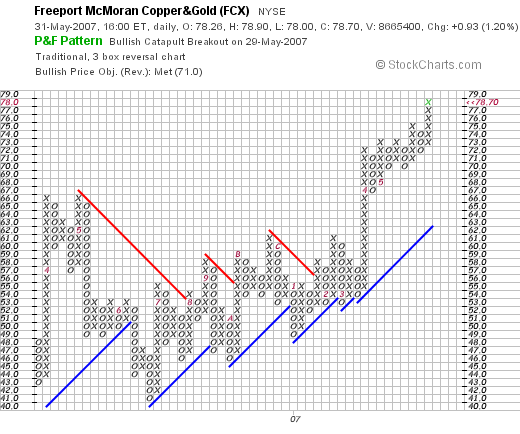
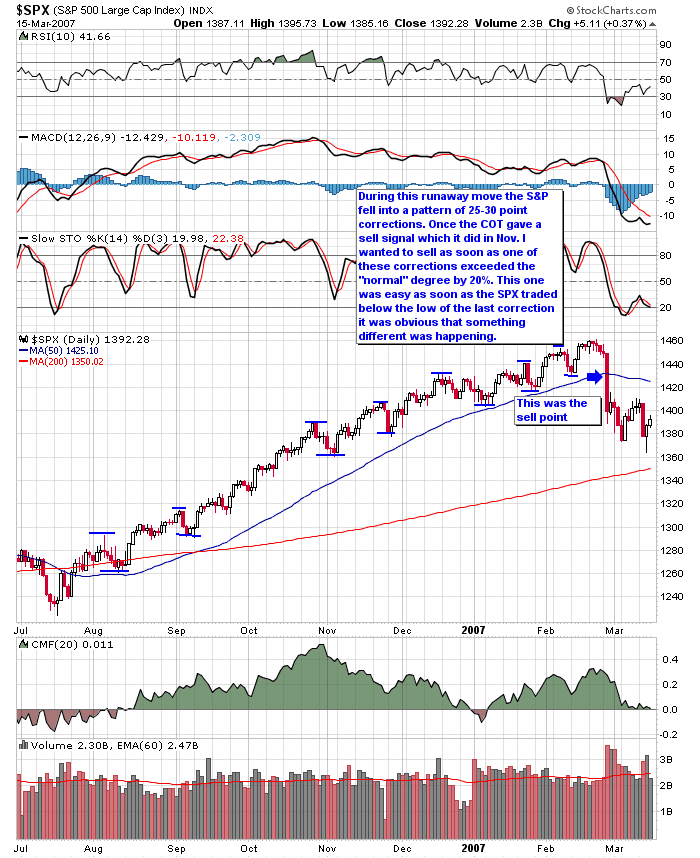
The first chart demonstrates a sell signal generated by a trend line break. The next chart is a point and figure chart of FCX the bullish price objective was met at $71. That is your sell signal. The third chart demonstrates the sell signal in Feb. accompanied by a COT sell signal. My experience has been that there just isn't anything that compares over the long haul to following the COT buy and sell signals. But here are a couple of options. As you may have noticed the VTO and bollinger band systems that I have described in the past all had very well defined sell rules. Before you enter into a trade know what your sell signal will be along with your stop loss level.


