Sunday, November 29, 2009

BUMPING INTO RESISTANCE

Several indexes have now tagged major resistance levels and been rejected. For my money the most important is the Nasdaq. This index has been leading this rally all the way. Two weeks ago I pointed out in one of the daily reports that the tech heavy Nasdaq was getting ready to run up against a big resistance level in the form of the declining 200 week moving average. I didn't think it would be able to get through that level on it's first try.


I'm betting on a 3-5 week pullback to regroup before this resistance can be overcome.

The S&P also came within a hairs breadth of tagging the 50% Fibonacci retracement. That's another resistance level I don't expect to get broken without a pullback to regroup.


Energy is now one of the largest sectors in the S&P. This rally is going to need the participation of energy to be sustainable.

Oil, however, is now setting up a volatility coil on the weekly charts.


Usually the initial break from one of these coils is a false move that is soon reversed. The reversal is usually much more powerful in magnitude and duration than the initial break. 

Since I don't think this cyclical bull is over I'm assuming the initial break is going to be down as the markets enter a brief 3-5 week correction. The powerful reversal  that should follow is in keeping with my theory that we are on the cusp of a rally of historic proportions in all commodity markets next year.

In order for this rally to continue we also need to see the banks participating. So far they have been unable to penetrate the 75 week moving average and are now forming a volatility coil just like oil.


The expectation here is the same as for oil, an initial break lower followed by a more powerful and durable move higher next year.

Finally the weekly chart of the S&P.


The 75 week moving average has been a pretty good indicator of bull and bear markets. Since the market is now back above that level we have to assume that this is no longer a bear market rally (actually it is a bear market rally, just a much bigger one, similar to this last cyclical bull from `02 to `07) but a new (cyclical not secular) bull market.

I expect any correction is going to be contained by the 75 week moving average just like they were during the last cyclical bull.

Friday, November 27, 2009

THE CORRECTION HAS STARTED

It appears the news that Dubai may default on its debt is going to be the catalyst for the intermediate correction we've been expecting. I have a feeling somewhere in here the solvency of Greece and maybe the Ukraine is also going to get thrown in the mix.

Intermediate corrections usually last about 1-3 months. I expect this one to be on the short side because of the way the daily cycles are lining up.

I can see it now, the bears are going to see the end of the cyclical bull market as the correction gets underway. But I can tell you that credit problems are not going to be the catalyst that brings this bull to an end. Let's face it we've already traveled that road. We aren't going to go down that path again.

Anyone who thinks that the credit markets are going to bring down this bull again are deluding themselves. Folks the central banks of the world have already proven they can defeat credit implosions with their printing presses. I guarantee as we work our way down into this temporary quagmire every central bank in the world is just going to crank up the presses and churn out another trillion or so of paper.

Lets face it, it really doesn't take much effort for a central bank to crank out a trillion dollar band aid. It's basically free money. Well at least that's what these idiots would like to believe.

This mini crisis is however going to sow the real seeds of our ultimate collapse. Once the blizzard of paper finally halts this panic, and it will,  it's going to start looking for another home. I have no doubt it will eventually find that home in the commodity markets.

The world is now setting the stage for what should turn out to be a historic run in commodity prices next year. All we need is a nice scary correction to freak out the Fed and start the presses running full blast again. Ironically it will be the threat of deflation that tips the world into an inflationary storm.

That, my friends, is what is going to bring down this cyclical bull and send the markets eventually spiraling down into the third leg of this secular bear market that began with the bursting of the tech bubble in 2000.

Inflation is the contagion that will destory this bull and the global economy, not credit contraction.

Oh, by the way, inflation can't be contained with a printing press!

Wednesday, November 25, 2009

WARNING SIGNS ARE STARTING TO MOUNT

Many of the market internals are now starting to flash warning signs. Despite moving to within a hairs breadth of making new highs yesterday many stocks have now dropped below their 50 day moving averages.


New highs/new lows are also collapsing.


The market is moving higher with fewer and fewer stocks participating.

And of course here is the reason the market is moving higher.


The Fed is trying to print our way to prosperity. It's never in history worked other than in the short term. It temporarily gave us a bubble in housing and credit during the 03-07 period. However I suspect most people if asked, would now say they would rather forego that party to avoid the hangover we are now experiencing.

The current leg down in the dollar is one of the longest in history. That means the chances of a counter trend rally are increasing every day. In the premarket this morning the dollar moved to within just a few points of that major support level at 74.31.

The danger of a significant bounce in the dollar and an intermediate level correction in all asset classes is increasing every day.

Tuesday, November 24, 2009

SETTING THE STAGE

Gold is setting the stage for what I expect will be an incredible move into late spring.

Gold is now in a fairly strong momentum phase of this C-wave. A small percentage of the public is starting to take notice. Everyone in the investment community is obviously aware of what's happening.

Now let me show you a weekly chart.


At twenty weeks gold has now rallied longer than any other intermediate leg of the entire bull market. Usually this cycle rarely lasts more than 20 weeks. The current long cycle was set up by the preceding short cycle. Have no fear this cycle will top and roll over.

Actually it's critical that it do so. Gold needs to wash out the euphoric sentiment that has now taken hold of the precious metals sector. All the late comers, especially the small percentage of the public that is starting to stick a toe into the water need to get washed back out of the market.

A sharp correction into the now due intermediate low will reset sentiment. Hopefully the correction is sharp enough to turn sentiment pessimistic. I'm starting to hear stories in the media about the gold bubble. A correction will confirm that theory for the gold bears and shake up the gold bugs.

However the consolidation from March 08 to the recent breakout is way too massive for the C-wave to be ending yet. So once the intermediate cycle bottoms gold is going to head higher again. All those players that got knocked out of gold during the correction are going to start questioning their decision to sell. Once gold starts making higher highs those players are going to come back into gold.

As I've said before all the energy bulls are going to start jumping ship and move that hot money into the precious metals market. Heck they've already started to do that now. But it's really going to crank up during the next intermediate cycle.

A much greater percentage of the public is going to notice and jump in as the second stage of this C-wave matures. (They of course will lose huge when the C-wave tops and rolls over into the next D-wave decline)

The end result is going to be a momentum move that is going to make the current rally look like kids stuff.

I expect we will see gold rally 50-80% from the bottom of the correction to the top of the C-wave and I expect it's going to happen in less than 4 months.

Now all we are waiting on is the correction that will separate the first phase of this C-wave from the second and set the stage for what will be the the most incredible rally of the entire bull market.

Sunday, November 22, 2009

REACHING EXTREME OVERBOUGHT LEVELS

One of the most dependable strategies in the investing business is that all markets eventually regress to the mean.

In the case of bear markets invariably the bigger the bear the larger the bull that follows.

There have been 7 bear markets in history similar to what we just went through. The greatest bear of course was the 29-32 bear. During that period the stock market lost 89% of it's value. The recent bear was the second most destructive bear in history with a peak to trough decline of 58%. Overall, 7 bears with declines of 46% or more and all 7 of those spawned powerful bull markets.

As can be expected the 32 bear spawned a first and second leg up that tacked on 177%. That market was of course in a class all its own. The other six bull markets managed two leg gains of between 51% and 73%.

Our current rally as of Monday's high had gained 68%. That ranks it third overall compared to the other seven bull markets born in the depths of the seven most destructive bears in history.

Needless to say we are in overbought territory.

All seven of those historic bulls suffered a secondary correction after the second leg topped out, of between 10-14%.

We are probably due for that secondary correction anytime now. And that includes gold for many of the same reasons which I've gone over in the nightly reports.


You can see from the chart that gold is now stretched further above the 10 month Bollinger band than any other time during the bull market. That in itself isn't a great reason to ease up on the accelerator.

There are however several other reasons I think that gold will probably correct along with the stock market in the weeks ahead. None of them really having to do with overbought conditions though. Taken together they suggest now probably isn't the best time to step on the gas. It might be better to tap the brakes a bit right here.

Now keep in mind tapping the brakes doesn't mean pull off the road, just take it down to second or third gear for a bit.

There's going to be a time to hit the nitrous again, just not 19 weeks into an intermediate term rally. Which by the way ties the longest intermediate rally of the entire bull market.

Saturday, November 21, 2009

HERE WE GO AGAIN

When the credit markets started to implode in 07 the Fed's answer to the problem was to print money. However the scale of the implosion in the financial markets wasn't going to be stopped easily. The momentum was so great that it still took the Fed a year and a half to halt the bear.


But let's face it, in a purely fiat system with nothing backing a currency except common sense, a central bank has the ability to print however much money they want. In that case there is no financial collapse, no matter how big, that can't eventually be halted.

Unfortunately in the attempt to repair the imploding credit markets the Fed sowed the seeds of the global economic destruction by spiking commodity prices, namely oil.


That parabolic rise in the CRB in July `08 was the straw that broke the camel's back and toppled the world into a deflationary collapse.

In that environment commodities turned and followed the rest of the markets down into what turned out to be the single worst collapse in commodity prices in history.

Now the FED is back at it again. when they should be withdrawing liquidity to prevent a repeat of what we just went through they continue to push the pedal to the metal. Pumping more and more trillions into the world.

So we are temporarily back in the fun part of monetary inflation where all asset classes are moving higher.


However we are already starting to develop problems. Despite collapsing demand the price of oil is again on the rise spurred on by those trillions and trillions of dollars floating around.


That liquidity is again finding its way into the energy markets. It won't be long before the fun part of monetary inflation comes to a halt again. This time it will happen much faster than the last time because the amounts of liquidity required to halt the credit market collapse were many multiples bigger than what was required to stop the tech bubble implosion.

As I've noted in my previous posts I'm expecting some kind of corrective move soon. Once that correction has run its course I expect we will see an incredible explosion in commodity prices.

An explosion that will destroy any economic recovery and set the next leg of the secular bear market in motion.

Wednesday, November 18, 2009

OUTDATED TECHNICALS

How often have we traded based on what we think are tried and true technical indicators? Often I suspect.

But here's the thing, most technical patterns that we think of as highly sucessful actually are not. Rememeber the market will eventually discount every system. 

Just as an example, how many of you think that buying breakouts or selling breakdowns is, if not a fool proof system, at least one with pretty high odds of success?

It does seem logical doesn't it? Just about any book you read will tell you that is the correct strategy.

However the truth is that most breakouts & breakdowns fail.

Smart money knows that for the most part these tried and true patterns no longer work.

Just as one example look at the top of the last bull market.


In mid 07 the market traded up to the 2000 highs. Most technicians spotting that resistance level sold. Bears probably sold short.

That started the move down, which of course reversed. (bull markets don't typically just die, they roll over gradually over time) Soon the bears began to get nervous about their shorts. At the same time the people who sold started to reconsider selling.

Then the market broke out to new highs. Now any self respecting technician knew at that point the market was going much higher. So what happened? Bears panicked out of their shorts and dumb money bought into the breakout.

But the market reversed. How could the market reverse unless there were sellers? Who in their right mind would be selling this breakout?

Smart money of course. Smart money knows that these patterns no longer work and they don't trade off these outdated patterns. They are trading off of fundamentals and new patterns.

This is just one of the many patterns that traders fall victim to.

I would be careful trying to trade patterns that you think give you an edge. Most of the time they do not.

Tuesday, November 17, 2009

INTERMEDIATE TOP?

Yesterday the HUI traded right up to a major resistance level.


The last intermediate top also traded up to a major resistance level before topping and rolling over into an intermediate correction.

The dollar also looks like it's trying to bottom. This morning the dollar has again bounced back above the 75 level. It's tried several times to break through this level and failed.


The dollar traded up as high as 75.41 premarket forming a swing low that has the potential to mark an intermediate bottom.

I do think the dollar is going to make at least one more attempt to break through that level as I think the S&P is going to tag that 50% Fibonacci retracement level before correcting. Let's face it the only way the S&P makes it to 1120 is with a weaker dollar since this entire rally has been based on nothing more than a rising ocean of liquidity.

There are several signs I'm looking for to confirm an intermediate top in stocks and precious metals and so far we haven't seen them. Until we do stocks probably still have one more last gasp higher. Miners may be leading a bit and I have my doubts that the HUI is going to convincingly break through 480 before suffering an intermediate correction.

We'll probably have some idea by how severe the short term correction is. If it's fairly strong then the miners may not be able to bounce all the way back up to 480 as the S&P tags the 1120 level...probably later this week.

Sunday, November 15, 2009

IMMINENT CORRECTION??

For several reasons that I went over in this weekends report I think we may be approaching an intermediate correction in stocks and probably gold and miners also.

I've never been a big pattern trader but there is an interesting one forming on the HUI chart.


The miners look like they may be in a megaphone type pattern. Usually these are topping patterns. I think this one will be a continuation pattern. Mostly because I don't believe this C-wave advance is even remotely close to being finished.  

Now I don't know if the miners will move all the way down to the lower trend line or not. What I can say with a great deal of confidence is that if they do, the current optimism in the gold bug camp will turn to black pessimism.

That's probably exactly what we need to spawn the next leg up. If the HUI can tag the 360 level over the next few weeks and especially if the correction is extremely sharp and quick we will have all the ingredients (extreme oversold conditions & extreme negative sentiment) neccessary for a huge rally and breakout to new highs.


Once the miners join gold at new all time highs I expect we are going to see an incredible rally.

Thursday, November 12, 2009

WATCH THE DOLLAR

An interesting development just occured on the dollar chart. Yesterday the dollar broke to marginal new lows and then reversed. Today we saw strong follow through. This is often how significant lows are put in.


I think we need to watch that all important 76 support level. If it is recovered then there's a very good chance the dollar is going to rally for at least 4-5 weeks. We all know that if that happens stocks are going to suffer an intermediate decline. Probably more severe than what we just went through.

Wednesday, November 11, 2009

PICKING A TOP; HERO OR FOOL?

I often see traders trying to pick a top. It's a favorite pastime of bears.

But I have to pose the question is it really worth the trouble? I think when I'm finished you will see that it not only isn't worth the effort but is actually one of the single worst strategies anyone can choose.

Picking tops is actually the bread and butter trade of Moe Ronn (our fictional character representing the average retail investor).

Let's say Moe thinks the market is due to top out and roll over into a bear market anytime based on his interpretation of the fundamentals (either real or imaginary it doesn't matter). So Moe decides he's done with the long side of the market and he begins shorting in an attempt to spot the top. He makes repeated attempts to short taking multiple small losses while he waits for the expected turn.

Now let's say Moe finally gets lucky and shorts XYZ stock at the exact top at $100. Let's also assume that Moe manages to hold on through the extremely violent whipsaws that almost always occur as a bull market slowly rolls over. (This is a huge assumption but just for the sake of argument we're going to give Moe this one).

Let's also assume that Moe manages to exit his short at the very bottom with XYZ trading at $20. Moe just earned himself a very nice 80% return minus however much he lost trying to pick the top.

That's how the Moe Ronn's of the world trade.

Now let's see how John I. Que goes about trading a bear market. Let's say John also thinks the market is due to roll over into a bear phase and he too wants to short XYZ. First off John doesn't attempt to try and spot the top. He knows that is a fools game. John just goes to cash and waits patiently for a sign that the bear has truly returned.

Eventually XYZ rolls over and sinks below the 200 DMA. By this time XYZ has lost $20 already. At this point John is confident we have now entered a bear market and he sells short XYZ. John also manages to exit his short close to the bottom at $20. John just lost one hell of an opportunity because he was late to the party, right?

Not quite, the opposite in fact. Consider that the drop from $100 to $20 was an 80% gain for Moe's short. Not bad, not bad at all. But the move from $80 to $20 was a 75% gain for John's short. John only gave up 5% by waiting till the bear clearly declared itself and in the process avoided the many false starts that Moe had to suffer through in trying to pick the top. In reality John most likely made more money by missing the top by $20 than Moe did by timing it perfectly.

BULL MARKETS & BROKEN TREND LINES

Here is another pattern I see bandied about quite often by the technical crowd.


It's the broken trend line and retest.  Now even in the best of times (read bear market) I doubt this pattern succeeds even 50% of the time.

But in a bull market, let's face it trend lines will get broken during corrections and since it is a bull market eventually the underside of the trend line will get tested.

However in a bull market that test of the trend line is eventually going to succeed every single time until we reach the end of the bull. So unless you think you've spotted the end of the bull trading these retests is a fools game.

I also see retracements bandied about quite often as a sign that the top is in.


Again I would have to point out that until this cyclical bull ends we are going to hit and surpass retracement levels. There is nothing special about any Fibonacci level that has to signal a top. Sure it may provide temporary resistance but until the bull comes to an end retracement levels are going to get broken.

I'm confident in saying that the the top of this bull will come not because of any particular technical level. When it does come it will be because the fundamentals no longer support the bull market. And in this particular case it will be because inflation exacts an unrepairable toll on the economy and corp. profits. We are eventually going to reach a point were all the liquidity created by the Fed just ends up poisoning the economy. At that point asset inflation will cease and we will begin the next leg down of the secular bear market.

At some point that will happen but there's no need, and I would say no edge, trying to determine that tipping point based on nothing more than technicals.

For now the trend is up. Following the trend is still the safe bet.

Just keep in mind that we are sowing the seeds of the next calamity and at some point this party will end. I just don't think it's time to go home just yet.

Monday, November 9, 2009

FIGHTING THE TAPE

Tonight I wanted to explore a behavior that is as old as the markets...fighting the tape. There seems to be quite a bit of this going on lately, especially since the market broke through 875.

Now I'm talking about perma bears trying to pick a top but this behavior is not exclusive to bull markets & perma bears. Hardly! Fighting the tape is one of the reasons bear markets can do the terrible damage that they do. Perma bulls jump on every rally in a bear market looking for a bottom that never comes. Well it never comes until the last bull is broke.


Bull markets are the same. They continue to take money from the bears day after day and month after month until there are no bears left solvent. Once that happens the bull market is over.


So why do investors choose to fight the tape? Let's face it if we could simply control our urge to trade against the large trend we would have very few losing trades. Why? Because as long as one has a little patience every trade in the direction of the major trend is eventually going to get rescued when the main trend resumes.


It's such an easy concept but one that just seems almost impossible for many traders to follow.


My best guess is that traders have a bias that they aren't willing to let go of, often based on their view of the underlying fundamentals. They take a trade based on those fundamentals, real or imaginary, and then when it goes against them they start to rationalize why the market will soon come to its senses. Often they make the unforgivable mistake of adding to losing positions.


I can't even begin to tell you all the nonsense I've read over the last several months. All of it useless for anything other than convincing oneself to stay in a losing trade against the major trend.


Let’s take the recent cyclical bull market as an example. Since the March bottom we've seen 24 up weeks and 12 down weeks. By being short in this environment the odds are stacked against you 2 to 1 and considering the up weeks have gained a tremendous amount more than the down weeks the true odds are probably closer to 4 or 5 to 1.


If you were playing Russian Roulette and the gun had 4 bullets in it rather than 1, would you still play? Just kidding I trust no one is that stupid. However there are literally millions and millions of investors that are playing Russian Roulette with their portfolios when they fight the trend.


Now let's say you have a mechanical system that puts the odds more in your favor. The Bollinger band crash trade does exactly that, especially in a bear market. The reason being is that the largest rallies tend to come in bear markets. However the same can't be said for bull markets. I know of almost no mechanical systems that effectively short bull markets. So in this instance mechanical traders may have a bit of an advantage trading against the trend in a bear market as opposed to a trader trying to find a mechanical approach to shorting a bull market.


I did develop one mechanical Bollinger band short trade several years ago but even that probably doesn't have a positive expectancy even though it does tend to have a high win rate. The problem is that the few losers are so large they overpower the many small winners.


The only tool I've seen that really has much success shorting a bull market is cycles. And even then they only succeed if the cycle manages to stretch into the very latter part of the timing band. If not then you run the risk of shorting too early and having to endure a final leg up that blows out your shorts.


So even cycles are only rarely dependable at signaling profitable shorting opportunities in bull markets.


If only investors could resist the urge to fight the trend most would actually make money in the markets.


So why do we fight the tape? What say ye?

Sunday, November 8, 2009

THE EASY PATH

For years now I've browsed financial blogs and almost without fail I've found that the average, (and not so average) retail investor thinks he can time the market just by looking at charts.

Most people will always take the easiest path if given a choice. Let's face it looking at a chart and making a financial decision is by far the simplest way to invest.

It requires very little time (probably seconds in most cases). No expenses (other than  basic charting software). Financial statements? Who has time to go over financial statements?

Does anyone truly believe that the Moe Ronn's of the world can really beat the system this easily?

I can assure you that you will not, at least not over the long haul, and you certainly will not get rich this way.

Certainly everyone looks at charts but there's a lot more to timing the market (history suggests that for about 99% of investors it's a losing proposition) than that.

Besides charts I would suggest one needs to also watch sentiment. That's going to require a tremendous amount of work or a subscription to one of the excellent sentiment services. Not exactly something that the average retail investor looking to make a decision in 30 seconds is going to commit to.

A working knowledge of cycles is also probably high on the list of requirements if one is going to have any hope of timing the markets. Again something that's going to require a lot of study or a subscription to one of the many cycle analysts.

Some idea of past historical tendencies. Again one is getting into many hours of research here.

Money flows. Unless you have some idea what the big money is doing and follow in their tracks you're going to be fighting an uphill battle. A subscription to Lowry's is going to cost you a very pretty penny.

And even if you are willing to put in the time and effort or fork out the dough to cover all angles of the market you still won't achieve a big edge over just throwing darts. Every system breaks down. And I can tell you that every one of these tools has in fact broken down repeatedly over the last 2 years and they will again.

Trying to time the markets is a very iffy proposition even if you have all the tools stacked in your corner. Do you really think you are going to have long term success by simply looking at a chart and clicking a mouse?

History suggests you will not!

Thursday, November 5, 2009

THE MOMENTUM PHASE

C-wave's tend to unfold in two phases both ending in powerful momentum moves. The first phase tends to morph into an extended consolidation while the second phase of a C-wave tends to top with gold extremely stretched above the 200 DMA to be followed by a severe D-wave correction.

We've now seen gold break out of the multi month consolidation and test that break out.


Gold should be fast approaching the momentum phase of this part of the C-wave. Actually looking at the longer term chart it's apparent gold is already in the beginning stages of the momentum phase. I expect this to last probably through most if not all of November to be followed by a consolidation phase in December and possibly most if not all of January to allow the 200 DMA to catch up a bit.

At that point we should see one more powerful momentum move as the second phase of the C wave completes to be followed by a sharp D wave decline into and through the summer months.

All in all it's probably not a good idea to lose one's position as we enter this phase of the rally.

Wednesday, November 4, 2009

THOSE DECEPTIVE CHARTS

I'm going to show you just a few of the charts I've seen bandied about lately supporting the bearish view on gold and miners. The first one is the standard trend break.


This one is the same as the S&P and seems to have tremendous significance to the crowd that takes technical analysis as gospel.

The rising wedge is another one I've never really bought into, mostly because it seems like technicians seem to take great liberties in where the upper trend line originates. Anyway this seems to hold terribly bearish connotations when this pattern materializes.


Now if one decides to change the origin of the upper trend line we end up with a rising channel instead of a wedge and that tends to be a bullish pattern.


Another bad sign is lower lows and lower highs.


And of course if one is willing to tinker with the x or y axis you can expand the possibilities immensely.

However there are only two charts that have any significance to me at this point.


That my friends is a secular bull market. When it comes to gold that's all I really need to know.

Now if I'm going to be investing in mining shares then there's one more chart that matters to me and that is the gold:XAU ratio.


Historically a ratio of 5 or higher means miners are too cheap. At the moment miners are still so cheap it's ridiculous. As long as that remains the case it's going to overshadow any dubious chart pattern.

The fact is that miners are on sale at prices that have never been seen in history. When something like that happens I don't stop to ask questions, I just buy, buy, buy before the market comes to it's senses and corrects the mispricing.

Monday, November 2, 2009

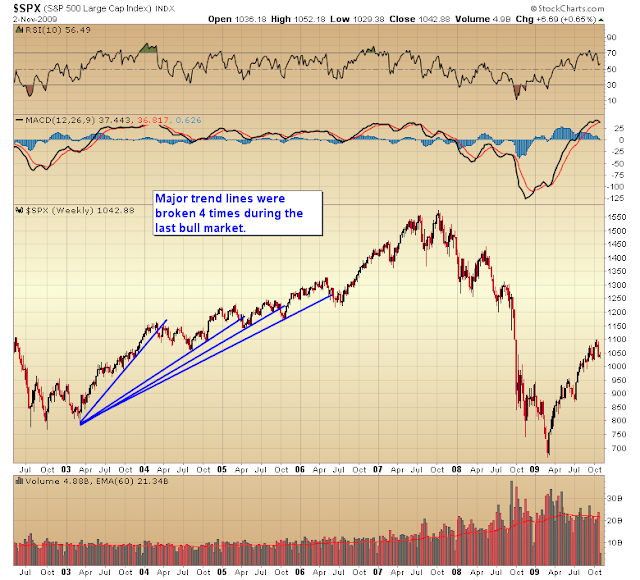
What exactly does a broken trend line mean?

Along the lines of my last post, I see a huge contingent of technicians focused on this broken trend line as a sign that the cyclical bull is finished.


I have to wonder if a simple trend line break is really all that important. It certainly wasn't during the last cyclical bull market.


Anyone taking anything other than short term positions based on a broken trend line got their head handed to them.

Like every tool investors use, sometimes trend lines work  and sometimes they whiff badly.

More important in my mind is the direction of that 200 DMA. As long as that is moving higher I've got to assume we are in a cyclical bull market. As long as that remains the case then broken trend lines aren't going to mean a lot.

The longer term trend is now up. Corrections should be viewed as counter trend moves that will eventually reverse. If you think you are going to be good enough or lucky enough to spot the bottom of these moves then by all means try to trade them.

If you prefer to keep the odds in your favor then you just go to cash when you think the market is due for a breather and get long again as close to the bottom as you can with the knowledge that if you don't time it perfectly it's no big deal as the larger trend will eventually bail you out.

Sunday, November 1, 2009

Divergences, Divergences

I see that the blogosphere has latched on to the momentum divergences as a sign the market is going to crash soon.


Now maybe it will and maybe it won't, no one knows for sure. What I do know is that a momentum divergence is certainly no guarantee of anything.

Folk's all charts are nothing more than a record of the past. The past is no guarantee of the future. That's the reason it's so hard to get rich with technical analysis alone. Sometimes it works and sometimes it doesn't.

There's nothing that says a momentum divergence can't all of a sudden accelerate and wipeout the divergence.

Take a look at the S&P back in `03. At the time we were rallying out of a severe bear market bottom based on no fundamental base other than massive liquidity injections by the Fed. Sound familiar?


In theory this divergence should have led to the market rolling over into a continuation of the bear market. I know the vast majority of bears were expecting this very thing at the time, and betting heavily on that outcome I might add.

Now as we all know, things didn't play out exactly like the bears and technicians were planning. The Fed's oceans of liquidity were stronger than the charts.


We are now in a very similar situation. Except this time Bernanke has staked everything on his printing presses. He's obviously willing to destroy the dollar in his attempt to defeat the forces of deflation and the laws of economics. The US refuses to suffer the consequences from the massive excesses of the past two decades. Instead we just keep going deeper in debt trying to mask the growing cancer imbedded in our financial system.

So as long as Bernanke is willing to keep churning out liquidity one should be very wary about technical indicators, especially ones that position you short.

I guarantee a couple of trillion dollars is going to be a lot more powerful than any chart pattern or technical indicator.